Powder Packing Behavior and Constrained Sintering in Powder Processing of Solid Oxide Fuel Cells (SOFCs)
Article information

Abstract
Widespread commercialization of solid oxide fuel cells (SOFCs) is expected to be realized in various application fields with the advent of cost-effective fabrication of cells and stacks in high volumes. Cost-reduction efforts have focused on production yield, power density, operation temperature, and continuous manufacturing. In this article, we examine several issues associated with processing for SOFCs from the standpoint of the bimodal packing model, considering the external constraints imposed by rigid substrates. Optimum compositions of composite cathode materials with high volume fractions of the second phase (particles dispersed in matrix) have been analyzed using the bimodal packing model. Constrained sintering of thin electrolyte layers is also discussed in terms of bimodal packing, with emphasis on the clustering of dispersed particles during anisotropic shrinkage. Finally, the structural transition of dispersed particle clusters during constrained sintering has been correlated with the structural stability of thin-film electrolyte layers deposited on porous solid substrates.
1. Introduction
A solid oxide fuel cell (SOFC) is considered one of the most promising energy conversion systems because of its high conversion efficiency for production of electricity and heat with negligible air-pollutant emission and considerably reduced greenhouse gas emission.1–3) In most stationary applications, SOFCs provide unique advantages such as non-requirement of precious metal catalysts, fuel flexibility, and high energy density.4,5) Fuel cells can be used in a wide range of systems including small-scale power sources for portable applications, small auxiliary power units for automotive applications, combined heat and power systems for stationary applications, and large-scale central power generating systems.6)
The major advantage of an SOFC is its ability to generate electricity at relatively high temperatures compared with other fuel cells. For example, high-temperature SOFCs can produce high-quality exhaust heat for cogeneration, and can be incorporated into gas turbines as pressure increases to improve the overall efficiency. Unfortunately, the high operating temperatures of SOFCs have increased the fabrication cost, limited the choice of materials, and decreased the durability, thus shortening the lifetimes. These drawbacks critically limit the progress in SOFC manufacturing.7–12) Lowering the operating temperatures of SOFCs leads to substantial benefits; it can reduce the fabrication cost, broaden the choice of materials, prolong durability, simplify thermal management (decreasing the stress between the triple phase boundary, TPB), improve cell consistency, facilitate faster start-up and cool down, and prevent or reduce cell degradation.9,13–19)
SOFC commercialization is currently hindered by the high manufacturing costs. Therefore, researchers have attempted to reduce the operating temperature and material cost, which are crucial to lowering the overall fabrication cost. Small-scale production of SOFCs with minimum thicknesses not only decreases the operating temperature but also minimizes the ohmic resistance across the cell. For instance, SOFCs can be operated at reduced temperatures (e.g., 600°C) by reducing the electrolyte thickness and adopting electrode-supported, such as anode-supported designs.17,20,21) Practical and suitable fabrication methods for SOFC single cells must be carefully selected and executed to achieve low-thickness SOFCs. Preventing mechanical failures, generating high power density outputs, and improving the performance of SOFCs are also essential for their commercialization. 8,16,22–25)
Despite the fuel flexibility provided by SOFCs, the up-to-date SOFC commercialization has been hindered by high capital costs, and thereby, the global SOFC market has been heavily driven by government subsidies and/or public policies.26–28) Numerous studies and cost projections based on the learning effect have been reported for automotive fuel cells systems,22,26–30) but fewer studies have focused on distributed applications of SOFCs.26,27,31) It has been reported that stack cost makes up about 40–50% of the system cost, and cell cost makes up about 50% of the stack cost at all production volumes, followed by cell sealing (10–18%) and interconnects (10–18%).26,27) Thus, material cost makes up almost 80% of stack cost, as shown in Fig. 1; therefore, a realistic cost reduction approach must be adopted, including the use of thinner cells and stack components, manufacturing automation, and in-line quality control.26) Stack cost involves the cost of material, operation, equipment, building, and labor. The initial capital investment in the equipment makes up about 40% in small volume production, but the cell making cost makes up about 65–70% of the stack manufacturing cost in high-volume production.26,27) Further cost reduction needs to be accomplished via innovative manufacturing technologies, e.g., roll coating, instead of conventional screen printing, for high production throughput and reduced low initial capital investment.32)

2. Processing Issues of Yttria-Stabilized Zirconia (YSZ)/Gadolinium-Doped Ceria (GDC) Bilayer Electrolytes
Even in high-volume production, power density and process yield are regarded as the prevailing parameters contributing the most to the stack manufacturing cost; contribution of other parameters is much less.26,27,31) In recent years, bilayer electrolyte systems have been rigorously explored as a potential means to improve the electrochemical and thermochemical performances of SOFCs. In particular, two-component electrolyte layers in a bilayer electrolyte system are expected to overcome the drawbacks associated with a single electrolyte layer. Bilayer electrolyte application results in a synergistic effect, which can overcome the drawbacks of individual layer electrolytes and lead to improved power density and prolonged lifetime. Although the bilayer electrolyte systems have advantages, there are several factors that need to be considered, such as shrinkage compatibility, thermal expansion coefficient (TEC) compatibility, and possible interdiffusion between the two components. Among the various bilayer electrolyte systems, ZrO2/CeO2 can be highly promising if the processing issues are properly addressed.
Generally, the ZrO2/CeO2 bilayer electrolyte system exhibits high oxygen ion conductivity and low reactivity to electrodes (due to doped CeO2), and excellent stability and low electronic conductivity (due to doped ZrO2). Doped ZrO2 layers have been used with doped CeO2 layers to block electronic current in reducing environments, leading to enhanced open circuit voltage (OCV). If the doped ZrO2 layer is thin enough, the electrolyte resistance is not increased much compared with a doped CeO2 electrolyte alone. In addition, a doped CeO2 layer is widely used as a diffusion barrier to minimize the formation of resistive reaction products such as La2Zr2O7 and SrZrO3 because CeO2 is much less reactive than ZrO2 to mixed ionic-electronic conducting (MIEC) cathode materials.33) ZrO2/CeO2 co-firing above 1300°C resulted in almost three-fold increase in the interface resistance due to the formation of a resistive solid solution by interdiffusion. 33–35) Therefore, for CeO2 layer formation, post-firing was performed at ~ 1200°C on a densified YSZ electrolyte layer to eliminate the interdiffused layer. However, this led to fairly porous CeO2 layers with poor electrolyte performance, and these layers failed to protect the ZrO2 layer against undesired reaction with Co-based MIEC cathodes.36–39)
Generally, bilayer electrolyte systems with two different configurations are used: a thin CeO2 interlayer between the cathode and ZrO2 layer, or a thin ZrO2 interlayer between the anode and CeO2 layer. In either systems, the ZrO2 layer should be sufficiently thick and crack-free to prevent the reduction of CeO2, and sufficiently thin to minimize the ohmic resistance. It is to be noted the ZrO2 layer should have an optimum thickness; otherwise, its performance will deteriorate because of OCV loss and ohmic resistance increase. The minimum thickness that is required to achieve a stable OCV with the ZrO2-based electrolyte layer at a given temperature depends on the process and operating temperature.40–50) Any further increment in the ZrO2 layer thickness will only increase the ohmic resistance, without enhancing the performance. If a thin continuous CeO2-based electrolyte layer is deposited on a YSZ layer of optimized thickness, even low thicknesses are sufficient to prevent the reaction between LSCF and YSZ.
Although the optimum thickness of the ZrO2 layer considerably varies with respect to the process, producing extremely thin, defect-free layer in each process should be the first priority to successfully fabricate bilayer electrolyte SOFCs with high performances. Regardless of bilayer configurations, the major fabrication challenge is to economically develop a gas-tight, pinhole-free ZrO2 electrolyte layer on a porous substrate, while maintaining low thickness. Cost-effective fabrication routes must be explored through technical innovation in bilayer electrolyte processing to achieve cost reduction and performance enhancement.
Till date, only a couple of studies have demonstrated the prevention of processing issues: interdiffusion between ZrO2 and CeO2 layers and poor densification of the CeO2 layer. For instance, Fe2O3 was used as a sintering aid for both YSZ and GDC layers, which led to the effective reduction of interdiffusion at a low co-firing temperature of 1250°C. Moreover, the reaction zone width reduced from ~ 3 μm at 1400°C to < 1 μm at 1250°C.43) A power density of 0.62 W/ cm2 at 0.7 V (Pmax = 0.75 W/cm2; 650°C) was reported in a cell with a 10-μm-thick YSZ/3-μm-thick GDC bilayer electrolyte and a composite lanthanum strontium cobalt ferrite (LSCF)–GDC cathode.43) The authors attributed the excellent cell performance to several microstructural features including low YSZ/GDC bilayer electrolyte resistance, minimal Sr diffusion and SrZrO3 formation due to the dense GDC layer, fine-scale Ni–YSZ anode microstructure, and improved anode support gas diffusion due to a higher fraction of connected pores formed at a low sintering temperature. 43)
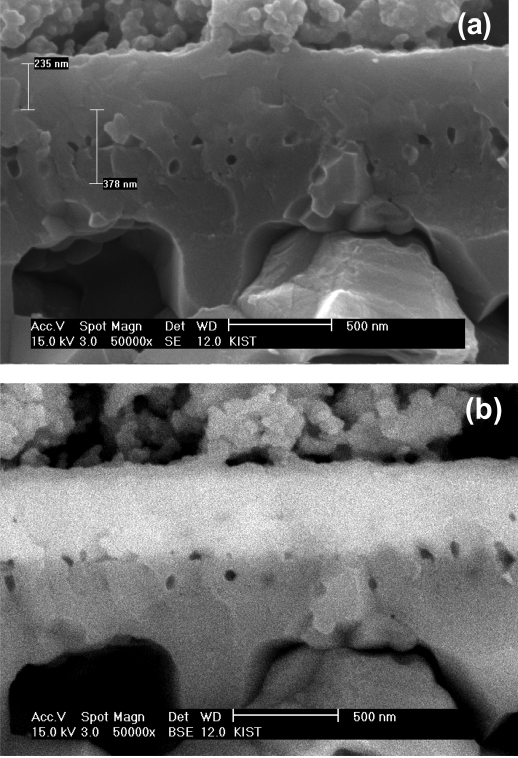
Further enhancement of power density has been achieved by reducing the thickness of the YSZ layer of an extremely thin bilayer electrolyte, wherein the so called “coat and bake” approach was employed, despite the external constraints imposed by the rigid substrate.49,51,52) Cells with YSZ (100 nm)/GDC (400 nm) bilayer electrolytes, which were deposited on rigid NiO-YSZ anode substrates by chemical solution deposition (CSD), followed by sequential post-firing below 1100°C, exhibited a power density of 1.1 W/cm2 at 0.7 V (Pmax = 1.35 W/cm2; 650°C) because of the substantially reduced bilayer electrolyte thickness, particularly YSZ layer thickness, as shown in Fig. 2.49) Although the “coat and bake” process is very simple, special care should be taken during the preparation of coating solutions to overcome the constraining effect arising from a rigid substrate. 49,51,52) The details of the “coat and bake” approach to resolve the constrained sintering of the YSZ electrolyte layer is thoroughly discussed later from the standpoint of a bimodal packing model, which requires significant modification, considering the presence of a rigid substrate. Moreover, it should be noted that by using the “coat and bake” approach, which can continuously produce thin cells, significant cost reduction of SOFCs can be achieved, as pointed out in the previous section.

3. Reinterpretation of Composite Cathode Compositions Using a Bimodal Packing Model
Numerous efforts have been devoted to the development of SOFCs and stacks of various shapes and (stack) geometries. 22,53–56) Regardless of the cell types and stack geometries, the individual layers and multilayers of SOFCs are made up of ceramic-ceramic composites.6,22,53–59) With regard to cathodes especially, the majority of previous investigations focused on developing porous electrodes of binary composites with high phase connectivity (all components) to produce high-performance electrodes through efficient transports of ions, electrons, and gas molecules.
Although numerous studies on the optimum compositions of binary composite cathodes have been reported, there are hardly any papers dealing with the fabrication process, green microstructure, and sintering behavior.60–64) The green microstructure is represented by powder characteristics, packing characteristics, and pore characteristics, which affect the sintering behavior of green bodies and their microstructure development.65–68) In principle, all composites are composed of matrix and dispersed phases, which are either continuous or discontinuous in the distribution state. The distribution state is controlled by the powder characteristics, dispersion structure, mixing state, and packing behavior of the component powders.65–67) Although composites undergo differential sintering due to the difference in the sintering rates of the components, controlling the differential sintering could enable the production of a porous composite cathode with the desired microstructure and multi-functional properties.60–65)
If the composites are subjected to sintering, the matrix with continuous distribution will undergo significant shrinkage in the initial stage because of the internal constraints imposed by the dispersed particles in the form of tensile stress fields.69–74) As the matrix shrinkage progresses, the dispersed particles interact with each other and form small local clusters. With further matrix shrinkage, a number of local clusters interact with each other and eventually form a global cluster, covering the whole volume space of the composite. 75–79) After the formation of a composite structure with both components in the continuous distribution state, composite sintering leads to the formation of different network structures, competing with each other throughout the volume space.80) To detail, if the sintering rate of the dispersed particles is lower than that of the matrix, composite densification will be retarded. In the extreme case where the dispersed particles are non-sintering, composite densification almost completely stops due to the strong rigidity of the network structure.78,79) On the contrary, if the sintering rate of the dispersed particles is higher than that of the matrix, composite densification will be accelerated.80) It should be reemphasized that composite densification relies on the competitive nature of the two continuous network structures formed by both the matrix and dispersed phases in the co-continuous state, although matrix sintering controls composite densification in the initial stage, with the dispersed particles discontinuously distributed. In general, it is necessary to carefully determine the difference in the sintering rates of the matrix and dispersed phases to refine the final microstructure in both porous and dense states.80)
Despite the importance of green microstructure, the majority of previous studies have not paid due attention to the correlation between the powder packing structure and final microstructure of composite cathodes by taking into account the powder characteristics and consolidation routes. It is a complicated and time-consuming task to experimentally optimize the microstructures of composite cathodes because of the multiple processing steps; therefore, it is more desirable to predict the approximate range of optimum compositions. If the packing density of each component powder is known in a binary system, it is possible to apply the bimodal packing theory to predict the packing density of a composite, as shown in the specific volume diagram in Fig. 3.78,81–83) As observed, the packing behavior is linearly related to the composition when viewed in terms of specific volume (dimensionless), which is the reciprocal of fractional density. In an ideal case, maximum packing (minimum specific volume, V*), occurs at X*, where fine particles (A) fill the interstitial spaces between the large particles (B) in the co-continuous state (Px). If the volume fraction of B is lower than X*, the packing structure will be B dispersed in A matrix (P2). On the other hand, if the volume fraction of B is higher than X*, the packing structure will be A dispersed in B matrix (P3).78,80) Packing density in an ideal mixing state and that in a completely separate state (PRM) calculated using the rule of mixture can be described by the solid line VA-C-VB and dashed line VA-VB, respectively.

On the basis of the bimodal packing model, two aspects should be considered to obtain a high-performance composite cathode. First, the mixing homogeneity has to be excellent to achieve the maximum number of heterogeneous contact points between A and B, which is critical to increasing the TPB length.78–83) Second, the composition in the A-rich side must be nearly similar to that at X*, as long as the composite cathode can develop sufficient co-continuous network structure strength. This second condition is expected to overcome the high residual porosity by reducing the critical shrinkage for the formation of a co-continuous network structure, resulting in efficient gas transport.79,80)
Assessment of optimum composition data of previous studies from the bimodal packing standpoint might give an insight into the correlation between the powder packing behavior and microstructural development. By quantitatively analyzing lanthanum strontium manganite (LSM)-YSZ composite cathodes, Wilson et al.84) reported that only 57% of TPB length is active while 28% is inactive, and the rest is unknown. They suggested that the inactive TPB length was due to the underdeveloped LSM network structure. On the basis of powder characteristics of starting powders, it can be speculated that the composite packing structure consists of LSM dispersed particles surrounded by YSZ matrix particles. Moreover, the YSZ matrix shrinkage accompanies the LSM network development during sintering because the LSM particles are discontinuously distributed within the YSZ matrix particles. As the YSZ matrix undergoes shrinkage, LSM particles approach each other to form local clusters. Further matrix shrinkage forces these local clusters to interact and grow, eventually forming a continuous LSM network structure throughout the LSM matrix, covering the whole cathode volume space. The underdeveloped LSM network structure can be attributed to underfiring of the composites (only in a homogeneous mixing state). Notably, in a homogeneous mixing state, further matrix shrinkage can force the isolated LSM local clusters to interact with each other and to eventually form a global network structure at the expense of porosity. The other reason for the underdeveloped LSM network structure may be the lack of mixing homogeneity, possibly arising from agglomeration and/or poor co-dispersion of component powders. Thus, it has to be reassured that the bimodal packing model includes the detailed characteristics of powder packing behavior of each component and the mixing state. Otherwise, it must be used as a general guideline in determining the optimum composition of the composite cathode.
4. Component Segregation in Bimodal Packing
Another outstanding example showing the significance of controlling powder packing behavior could be found in the LSCF-GDC composite cathodes, wherein two research groups have reported considerably different optimum compositions despite using identical starting powders.85,86) They used different consolidation routes to produce composite cathode layers: slurry painting and spin coating. Although both methods are commonly used in coating practices, there are significant differences between them with regard to slurry conditions and powder packing. In spin coating, a low-viscosity solution or suspension is used, which is beneficial for rapid leveling and fast drying at high rotational speeds. On the other hand, slurry painting requires a solution with considerably high viscosity, preferably with thixotropic behavior.
GDC and LSCF powders with average particle sizes of 2.3 μm and 0.7 μm, respectively, have been reported by the two research groups.85,86) Because the particle sizes of components are considerably different, consolidation must be carefully controlled to prevent component segregation, particularly in spin coating. In spin coating, the coating layer is likely to experience very high velocity gradient because of the high rotational speed and low thickness, which subjects a solution or slurry to extremely high shear rates.87) Suspensions containing particles with bimodal distribution commonly have a tendency to show a shear thickening behavior due to extensive hydrodynamic interactions between coarse particles at high shear rates, i.e., shear-induced flocculation.88–91) Similar flow behavior is highly plausible in spin coating of dilute suspensions containing GDC/LSCF powders because the shear rate is expected to be extremely high for extremely thin coating layers at considerably high rotational speeds. Moreover, the liquid removal rate during spin coating is also expected to be uncontrollably high because of counter air flow on the coating surface with respect to the rotational direction. A high shear rate in combination with a high drying rate can strongly limit the particle packing efficiency because of insufficient liquid vehicle available for particle rearrangement. Consequently, the shear-induced flocs formed by hydrodynamic interactions between coarse GDC particles are likely to be persistent during the whole process.87,88) In other words, the shear-induced flocs formed by GDC particles possibly lead to low packing density, requiring additional GDC content for the reduction of interspace between GDC particles.
On the contrary, slurry painting is performed using a concentrated suspension with high solid loading, which effectively prevents component segregation because of the highly viscos flow behavior. Subsequent cold isostatic pressing (CIP) is likely to improve the packing density of the coating layer, which decreases the critical matrix shrinkage, leading to the formation of a co-continuous network structure due to the small interspace between GDC particles. The optimum compositions of GDC/LSCF composite cathodes are proposed to be 36/64 and 50/50 for slurry painting and spin coating, respectively. The difference in optimum compositions is attributed to the different particle packing structures formed by the two coating practices.
Nonetheless, the two compositions reported by the research groups can be represented using the specific volume diagram, as shown in Fig. 4.78,82,83) Here, we assume that both component powders have a fractional packing density of 0.4 and that the composites maintain excellent mixing homogeneity during the whole process. X* represents the composition with the minimum specific volume (i.e., maximum packing density) in a co-continuous state achievable in this binary composite system. In this diagram, the specific volumes in the coating layers obtained by slurry painting and spin coating can be denoted by C1 and C2, respectively, as long as mixing homogeneity is maintained. In the homogeneous mixing state, the LSCF matrix predominantly controls the composite densification, and subsequently, the dispersed GDC particles come closer. If we assume that the densification of composite cathodes mainly occurs by matrix sintering up to the co-continuous state, then the matrix shrinkage, which is denoted by the dashed arrows in the specific volume diagram, can be considered approximately the critical volume shrinkage for the formation of co-continuous LSCF-GDC composite cathodes structures by slurry paining and spin coating.78–80)

Unfortunately, the high shear field and fast drying in spin coating inevitably cause the ideal mixing state (solid lines) to poor mixing state (rule of mixture, dashed line) transition due to possible component segregation resulting from shear-induced flocculation of coarse GDC particles.87–91) In other words, if mixing homogeneity is maintained without shear-induced flocculation throughout the spin coating process, the specific volume of the coating layer can be represented by C2. However, the specific volume of the coating layer formed by spin coating is expected to be between C2 and CRM in the presence of shear-induced GDC flocs. This indicates that the interspacing between GDC particles is likely to increase in the composite coating layer formed by spin coating relative to the ideal case, requiring more LSCF matrix shrinkage than ɛ2 to form a co-continuous network structure. In practice, the composites at C1 and C2 require matrix shrinkage ɛ1 and ɛ2, respectively, by which the compositions of both composites converge to X* to form co-continuous structures, as depicted in Fig. 4.78,80) Thus, the difference in the optimum compositions of composite cathodes can be attributed to the fact that the high shear rate in spin coating forces the optimum composition to shift towards high GDC volume fraction because of shear-induced flocculation of coarse GDC particles.88–91) The aforementioned argument clearly indicates that the mixing state of a composite cathode should be critically examined in each processing step, from the starting powder to the final consolidated state. Otherwise, it will be almost impossible to reproduce the optimum compositions suggested in the literature on the basis of the mixing ratio and sintering condition.
5. Interaction of Inclusion Particles at Low Inclusion Volume Fractions
Thus far, we have dealt with the sintering of binary composite cathodes from the view point of the bimodal packing model, which was very useful in explaining the clustering behavior of dispersed phase particles. When a ceramic coating layer, in either the binary composite or bimodal powder, is subjected to sintering in the presence of a rigid substrate, sintering shrinkage occurs only in the direction perpendicular to the substrate. Unlike the case of composite cathodes discussed above, if the content of the dispersed phase particles is relatively low in a binary composite or bimodal powder, their clustering behavior is expected to be influenced by the anisotropic matrix shrinkage caused by external constraints imposed by the rigid substrate.80,92–94)
Weiser and De Jonghe have used the term “effective volume fraction” to explain the effect of inclusion size on the retardation effect of SiC-ZnO composites at a low SiC volume fraction.70) According to them, there exists a nearly invariant matrix shell composed of one matrix grain (adjacent to the inert dispersed SiC particles), which causes increased sintering inhibition with decreasing SiC size. In fact, when the dispersed SiC particle size was decreased from 75 μm to 0.25 μm, the retardation effect observed with 5 vol% addition of 0.25-μm SiC particles was equivalent to that observed with 18.5 vol% addition of 75-μm SiC particles. In addition, according to them, it was highly possible that the degree of clustering of the dispersed phase particles had a significant effect on composite densification.69,70) Similarly, Lange et al. introduced the term “interactive network” with “non-touching” dispersed inclusions to explain constrained sintering at low inclusion volume fractions, which is in contrast to the complete stoppage of sintering due to the formation of a network by “touching” dispersed inclusions at high inclusion volume fractions.79)
6. Clustering of Nanoparticles Dispersed in Ceramic Coatings Formed by CSD
Regardless of the networks formed by touching or non-touching particles, it has been clearly demonstrated that the constraining effect of dispersed phase particles on composite densification is tremendously augmented as their sizes decrease.70) Thus, it is interesting and instructive to look into the densification of binary composite or bimodal compact with the introduction of nanoparticles as the dispersed phase in finer matrices. As pointed out earlier, the effective volume fraction is expected to drastically increase with the addition of nanoparticles as the dispersed-phase particles, which tends to effectively increase their interaction to form an interactive network at very low volume fractions. This was clearly demonstrated in the densification of thin YSZ and GDC electrolyte layers on a rigid substrate prepared by spin coating of chemical solution containing “slow-sintering” nanoparticles.49–51)
Oh et al. successfully developed an extremely thin bilayer electrolyte SOFC using a gas-tight YSZ electrolyte layer with nanoparticle clusters.49–51) In essence, the coating layer can be regarded as a bimodal powder compact composed of “slow-sintering” nanoparticles surrounded by a superfine sol particle matrix. They found that about 5 vol% nanoparticle addition effectively suppressed major process flaws in the early stage of sintering and caused further densification to gas tightness in the later stage. These dual functions were driven in a controlled manner mainly by adjusting the volume fraction of dispersed nanoparticles on the basis of nanoparticle clustering, and subsequent cluster-cluster interactions.51) In essence, the cluster rigidity should be sufficiently strong for reduction of shrinkage rate in the early stage, while it should be sufficiently weak for further densification through cluster reorganization caused by matrix sintering “stress.”
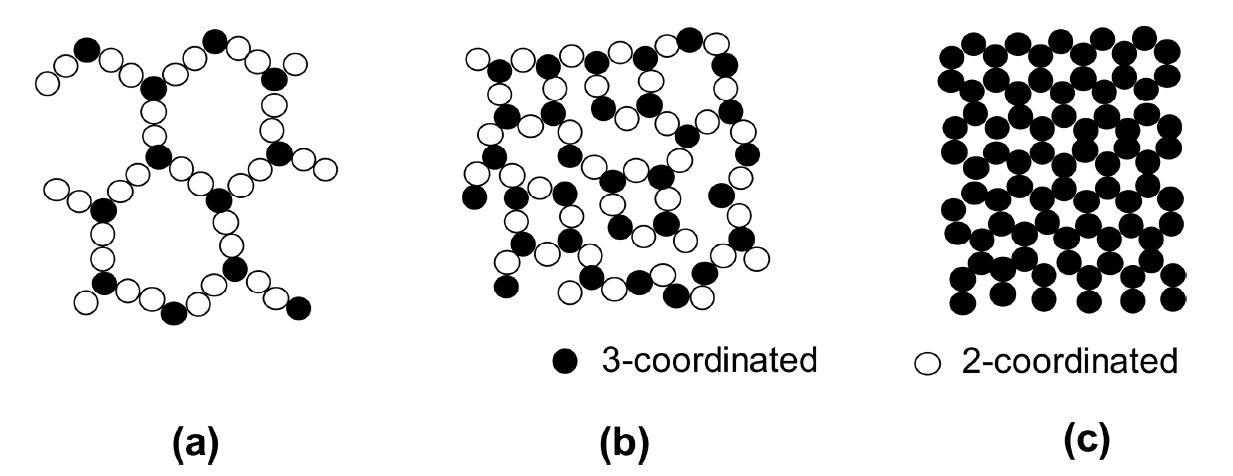
In fact, the cluster rigidity of dispersed particles in the matrix can be presented by the average particle coordination number in a cluster if the bond strength between the touching particles is assumed to be constant. According to previous studies on the interrelationship between packing density and coordination number, the most probable value of fractional packing density for random packing of monoMarch sized spheres is between 0.59 and 0.64, with approximately six contacts per sphere.95–97) The percolation theory predicts a percolation threshold of ~ 16 vol% dispersed particles, with the estimated coordination number near 4.98,99) In a thin electrolyte layer formed by CSD, where the bimodal system consists of nanoparticles dispersed in a much finer sol-particle matrix, a reference value could be indebted to the sol-gel transition for coordination number of dispersed nanoparticles.100) The gel structure can be described as a three-dimensional (3D) network structure formed by interconnected sol particles with the solvent immobilized inside. Although the sol-gel transition takes place in a 3D volume space, it has been suggested that sol-gel transition can occur even at critical solid loadings as low as 0.83 vol%, at which the average coordination number of the gel network is expected to be only 2.50 (3-2-2-3). When the coordination number increases to 3, the critical solid loading is about 5 vol%.100) The critical solid loading was estimated under the assumption of no particle rearrangement and cluster reorganization upon gelation, which is nearly identical to the sintering of binary composites or bimodal compacts. Thus, once the dispersed particles form clusters, reorganization is very difficult because of the hindrance effect caused by the matrix particles. Nonetheless, it should be noted that at remarkably low solid levels of < 5%, a three-dimensionally continuous open network structure can be formed if the particle size is decreased to extraordinarily fine scale, as shown in Fig. 5.100)
7. Anisotropic Shrinkage of Ceramic Coating in the Presence of a Rigid Substrate
Thin ceramic films for various applications are often produced by coating of solutions or slurries, followed by sintering. Because the films are constrained on rigid substrates, the in-plane shrinkage is inhibited, and densification takes place only along the thickness direction. Constrained sintering of films reduces the overall sintering rate and frequently leads to major processing flaws.101) Notably, structural damages are caused by biaxial tensile in-plane stresses, and they are typically initiated in the early stages of densification in the vicinity of pre-existing defects.102–104) In addition, on the basis of the study on Al2O3 films, it has been suggested that crack growth occurs due to the coalescence of microcracks with each other and with the main cracks in the diffuse damage zone. Despite the damaging mechanism, sintering at lower temperatures and/or slow heating rates is expected to make the ceramic films resistant to cracking and damage.102) This can enhance coarsening in favor of neck growth and reduce the shrinkage rate in favor of transient stress decrease. The extensive damages developed in GDC films prepared the by sol-gel process can be attributed to the uncontrollably fast densification along the thickness direction in the absence of sufficient interparticle bond strength due to the underdeveloped in-plane neck areas.101,102)
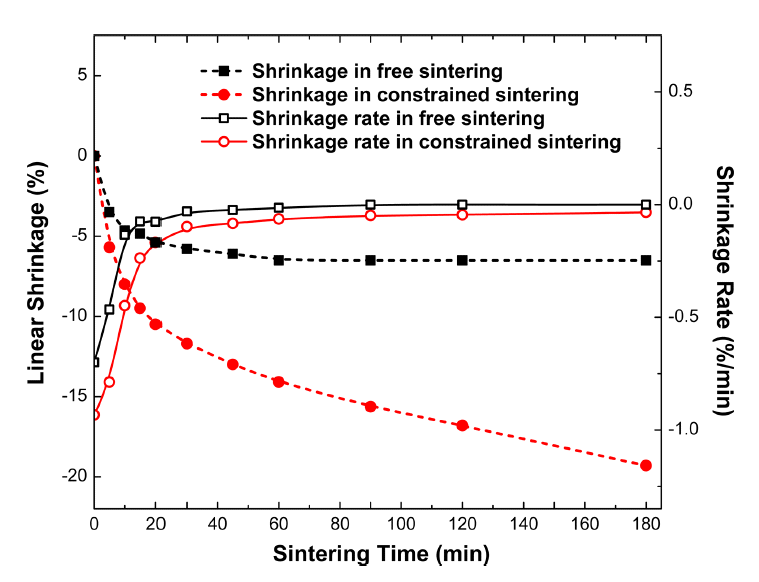
As the magnitude of transient stress during constrained sintering of ceramic films is closely related to the densification rate, the shrinkage rates of Al2O3 thick films in constrained sintering and bulk samples in free sintering were calculated and replotted for comparison using the isothermal sintering data reported by Guillion et al., as shown in Fig. 6.93) Although the linear shrinkage in constrained sintering (thick films on rigid substrates) is about three times greater than that in free sintering, the total volume shrinkage is nearly identical in both free and constrained sintering conditions, considering the fact that volume shrinkage equals to three-fold linear shrinkage. More importantly, the shrinkage rate in constrained sintering is approximately 1.4–4 times higher than that in free sintering in the first 15 min.93) It should be noted that the shrinkage rate in the first 5 min is almost 10 times higher than that at 15 min, indicating that controlling the shrinkage rate in the very early stage is critical in suppressing processing flaws. Theoretical calculation predicts that shrinkage rates in constrained sintering are ~ 1.8 and ~ 2.3 times higher than those in free sintering at relative densities of 75% and 90%, respectively, confirming that the difference in the shrinkage rate is persistent throughout sintering.92,105–108)
It should be borne in mind that the magnitude of transient stress during constrained sintering of a ceramic coating layer is proportional to the difference in shrinkage rates of the coating layer (in the presence of a rigid substrate of zero shrinkage) and substrate.92,109,110) Accordingly, a special measure should be taken to reduce the shrinkage rate of the coating layer, i.e., transient stress, to suppress the processing flaws in the initial stage of sintering and to obtain a dense electrolyte layer in the later stage. It has been a common practice to incorporate a slow-sintering second phase in binary composites or coarse particles in bimodal powder mixtures into a fast-sintering matrix.69–74,78–80) In the absence of chemical reaction or solid solubility between the components, the incorporation of slow-sintering particles will lead to reduction of the densification rate, because of the constraining effects described in the previous section.
In detail, in constrained sintering, the substrate constraint increases the shrinkage rate in the thickness direction by about 2–4 times as compared with that in free sintering. Accordingly, the shrinkage rate of the constrained electrolyte coating, especially that derived from chemical solutions or by sol-gel processing, is expected to be much higher, leading to a corresponding upsurge in transient stresses. Thus the probability of damage and failure tends to increase in constrained sintering of electrolyte coatings, proportionally to the increase in transient stresses, because the sources of pre-existing defects such as pores and surface roughness in the substrates remain unchanged.102) The production of dense electrolyte layers on porous substrates has been reported to be highly challenging by several researchers because of the presence of substrate irregularities, despite successful demonstrations on dense substrates.111–118) Therefore, it is more reasonable and practical to overcome the defect sources in the substrates by reducing the shrinkage rate of the electrolyte coating layer in the thickness direction with the addition of slow-sintering particles to avoid processing flaws.69,70)
Notably, a defect-free dense bilayer YSZ/GDC electrolyte has been successfully produced on a sintered porous anode substrate by deposition of a chemical solution containing a small amount of the respective nanoparticles (Fig. 7).49–51) The nanoparticles added to chemical solutions possibly decrease the shrinkage rate of the constrained electrolyte layer, particularly in the initial stage of sintering because of their internal constraints, but allow its further densification to a gas-tight state in the later stage by negating the internal constraining effect partially or fully. To bring into effect the dual roles of nanoparticles, the mutual interaction of the dispersed nanoparticles need to be carefully controlled under the external constraints imposed by the rigid substrate. 119) Discussed in the following section are the details of nanoparticle clustering and its effects on constrained sintering of electrolyte layers on rigid substrates.
8. Structural Transition of Dispersed Particle Clusters in Bimodal Coating
From the standpoint of bimodal packing, uniaxial shrinkage during constrained sintering possibly leads to mutual interaction among dispersed nanoparticles in a preferred orientation to form 1D clusters with preferential matrix shrinkage along the thickness direction.93,94,105–107) However, if the interspace between the 1D clusters is small enough for mutual interaction at a relatively high volume fraction of the dispersed particles, further matrix shrinkage likely causes the transformation of the neighboring 1D clusters into 3D clusters via either particle rearrangement or creep under the compressive stresses arising from uniaxial matrix shrinkage.70,78,79) Although it is interesting to investigate the critical volume fraction at which the structural transition from 1D to 3D clusters occurs, it is more instructive, at present, to examine the microstructural development in the presence of 1D and 3D clusters of dispersed particles in bimodal powder mixtures.
Figure 8 shows the SEM images of YSZ electrolyte surfaces prepared by spin coating of chemical solutions containing 2 vol% and 36 vol% nanoparticles, followed by sintering at 1100°C.120) As observed, the pore structures and grain microstructures of the YSZ electrolyte layers with 2 vol% and 36 vol% nanoparticles are considerably different, clearly reflecting the effect of the structure and rigidity of nanoparticle clusters on the constrained sintering of bimodal coating layer. Pronounced differences in pore structural features are observed, including residual porosity, pore size distribution, pore shape distribution, and spatial distribution of pores, which are believed to be closely related to nanoparticle clusters. For the sample prepared with 2 vol% nanoparticles, residual pores are located in the vicinity of relatively large grains, and they are mostly surrounded by the finegrain matrix. These coarse grains are likely associated with the nanoparticle clusters developed along the thickness direction, and are discontinuously distributed in the coating plane. On the other hand, for the sample with 36 vol% nanoparticles, significantly large pores are associated with coarse grains, which are interconnected in the coating plane, covering the whole coating volume. Although there exist exaggerated grains formed by nanoparticle clusters, the matrix grains of this sample are substantially greater than those of the sample with 2 vol% nanoparticles. The formation mechanism of microstructure in the sample with 36 vol% nanoparticles can be explained as follows. The 3D nanoparticle clusters covering the whole coating layer can lower the magnitude of the tensile stress imposed by the rigid substrate, because of extremely slow matrix shrinkage rate caused by the high cluster rigidity. As a result, the matrix particles are nearly free to sinter in local domains, almost independently of the substrate constraint, and the nanoparticles participating in the 3D cluster formation undergo intense coarsening at the expense of the neighboring fine matrix particles, with little or some contribution to the densification of the bimodal coating layer.

The plot of maximum grain size versus the content of YSZ nanoparticles (Fig. 9) clearly reflects the duplex grain microstructure with 3D nanoparticle clusters. Surprisingly, an abrupt increase in nanoparticle addition from 5% to 9% causes a discontinuous increase in the maximum grain size from ~ 400 to ~ 800 nm. This indicates that the YSZ nanoparticle clusters in the sol matrix particles undergo a structural transition from 1D to 3D in this regime. In the presence of 3D nanoparticle clusters, the sol matrix particles appear to be less constrained by the rigid substrate because of the reduced tensile stress resulting from the high cluster rigidity, and nearly free to undergo densification and grain growth by normal sintering. Moreover, the substantially large maximum grain size can be attributed to the increased number of diffusion paths between the nanoparticles present in 3D clusters, considerably reduced substrate constraint due to the high cluster rigidity, and intensive coarsening of nanoparticles at the expense of fine matrix particles.

Besides the importance of constrained sintering of bimodal coating, the significance of the maximum grain size cannot be enough emphasized because it plays a decisive role in defining the thermodynamic stability of the YSZ electrolyte coating layers. When coatings such as electrolyte coatings with 3D nanoparticle clusters are subjected to excessive grain growth, they can break up into interconnected fragments of coating layers, exposing the substrate to open air. Breakup of the electrolyte coatings leads to functional failure (technically unacceptable) of SOFCs caused by the disastrous fuel and air gas mixing. According to Miller et al., the onset of coating breakup occurs when the grain size is greater than the thickness of the coating layer.121) When a YSZ electrolyte layer deposited on an anode substrate is sintered at 1100°C, the minimum thickness of the YSZ electrolyte layer with 5% YSZ nanoparticles is found to be about 400 nm. If the sintering temperature is raised to 1200°C, the coating thickness must be increased to > 1 μm because of nearly two-fold increase in the maximum grain size compared with that at 1100°C.
With regard to clustering of dispersed nanoparticles, there exists a critical volume fraction, e.g., 5–9 vol%, at which cluster structures and rigidity drastically change. The uniaxial clusters formed at 5 vol% nanoparticle addition loosely interact with each other in the in-plane directions, presumably via the interactive network of “non-touching” clusters; on the other hand, in the case of clusters formed at 9 vol% addition, actual interactions develop between each other through “touching” clusters, as illustrated in Fig. 10.79) In other words, the degree of lateral cluster interaction determines the magnitude of cluster rigidity, which controls the local constraints in matrix sintering. Fig. 10(a) illustrates a case of little or some lateral interactions developed between uniaxial clusters in the thickness direction, which is likely to occur at a relatively low volume fraction of dispersed particles, presumably below 2 vol% of nanoparticle addition. In this case, the cluster structure formed by the dispersed particles is expected to be predominantly 1D with some isolated small local clusters. In contrast, Fig. 10(b) shows the clustering behavior of dispersed particles with considerable lateral interaction, which is expected to occur at 9 vol% nanoparticle addition. Here, the uniaxial clusters are linked to each other throughout the electrolyte coating layer, essentially forming 3D clusters.

Schematic illustrations of cluster-cluster interactions corresponding to different YSZ nanoparticle additions: (a) 5 vol% and (b) 9 vol% in the early stage of sintering, and (c) 5 vol% in the later stage of sintering.
Judging from the dense electrolyte layer in Fig. 7, the cluster structure formed at 5 vol% nanoparticle addition is assumed to be very close to that shown in Fig. 10(a) in the initial stage of sintering; however, in the later stage, it undergoes progressive transition to that shown in Fig. 10(b) through the reorganization of clusters driven by further uniaxial shrinkage (Fig. 10(c)). The reorganization of clusters is assumed to occur by particle rearrangement and sliding under the compressive stress fields arising from the uniaxial matrix shrinkage. For reorganization, the rigidity and coordination number of uniaxial clusters must be extremely low. A coordination number of 3 or below cannot be practically achieved in 3D space, but only in 1D space.100)
Although for nanoparticles with sizes of 10–20 nm, the uniaxial shrinkage in the thickness direction is favorable for the formation of open clusters with very low coordination numbers, the “effective volume fraction” proposed by Weiser and De Jonghe might be complementary to the aforementioned conditions.70) Fig. 11(a) schematically illustrates the very early stage of sintering in bimodal mixtures such as a thin electrolyte layer prepared by deposition of a chemical solution containing nanoparticles. Here, the sol matrix particles (d2) adhered to nanoparticles (d1) detach from the local domains of sol matrix particles during the early stage of sintering, and rearrange themselves as integrated parts of dispersed nanoparticles. Weiser and De Jonghe suggested that the “effective volume” effect arose from an invariant matrix shell composed of one matrix grain attached to the dispersed nanoparticles.70) Basically, as the dispersed particle size decreases, the effective volume fraction will significantly increase as shown in Fig. 11(b). When the sizes of dispersed nanoparticles and sol matrix particles are about 20 nm and 3 nm, respectively, the effective volumes of nanoparticles corresponding to 5 vol% and 9 vol% additions are expected to be about 11 vol% and 20 vol%, respectively. Thus, once the sol matrix particles in direct contact with nanoparticles are immobilized by necking, the effective volume fraction substantially increase from 9 vol% to nearly 20 vol% even in the very early stage of sintering.

(a) Schematic illustration of effective volume fraction effect for an invariant matrix shell and (b) effective volume fractions calculated using various combinations of d1 and d2.
9. Optimization of YSZ/GDC Bilayer Electrolyte
In addition to the thermodynamic stability criterion of the electrolyte coating layer in thickness-grain size relation,121) another technical criterion needs to be satisfied to achieve structural stability on a porous substrate. Usually, the anode substrate is composed of support and functional layers, whose pore structures are significantly different. Average pore sizes of ~ 3 μm and ~ 180 nm have been reported for the anode support layer and anode functional layer. According to the damage formation map defining the film stability, obtained by plotting film thickness versus pore size, the minimum thickness of YSZ electrolyte coating must be > 180 nm to avoid pore-induced defects.118) If the YSZ electrolyte layer thickness is > 180 nm, it is expected to be structurally stable throughout the fabrication process; however, its stability cannot be guaranteed during operation due to the possible pore size and porosity increase resulting from reduction of NiO to Ni. Therefore, on the basis of the technical criteria (grain size and substrate pore size) to achieve stable coating layers, it can be suggested that the thickness of the electrolyte layer should be > 400 nm.121)
In addition to structural stability, the OCV is an extremely important factor that determines the optimum configurations of bilayer electrolytes in real systems. Thus, the OCV has been a good indicator of increase in thickness of the YSZ coating layer of YSZ/GDC bilayer electrolytes. It has been reported that the OCV tends to increase with increasing thickness of the YSZ coating from 100 to 400 nm in thin YSZ/GDC bilayer electrolytes obtained by CSD.122) As the YSZ layer thickness exceeds 400 nm, the OCV becomes > 1.12 V, which is close to the theoretical value for a thick YSZ electrolyte layer.122) However, for the YSZ/GDC bilayer electrolytes with 100-nm and 300-nm-thick YSZ layers, the OCVs are found to be 0.94 V and 1.07 V, respectively,122) implying that these YSZ layers cannot completely protect the GDC layer against the reducing atmosphere. In other words, the GDC layer is exposed to the reducing atmosphere caused by gas leakage through the YSZ layer, resulting in a reduced OCV.
Finally, Table 1 compares the processing techniques and performances of cells containing thin electrolytes produced by spin coating of a solution or suspension. For reference, the electrolyte layers produced by spray pyrolysis and inkjet printing are also included. Judging from the OCV, the gas tightness of electrolyte layers achieved through the spin coating route is invariably superior to those achieved through inkjet printing and spray pyrolysis.120,123–125) The difference in the gas tightness levels is related to the delivery of wet source materials to substrates. Spin coating produces a coating layer by rapidly spreading the solutions or suspensions, which cover the entire substrate surface, essentially in a continuous supply. In contrast, spray pyrolysis and inkjet printing require droplet formation for material delivery to substrates, inevitably leading to partial drying near the droplet surfaces, and presumably surface segregation of organic substances by capillary migration. To obtain a coating layer with uniform particle packing, proper coalescence of droplets and subsequent rearrangement of primary particles need to occur, which require sufficient liquid vehicle and rapid redistribution, otherwise the electrolyte thickness will have to be substantially increased for high gas-tightness levels.126,127) Therefore, a proper selection of coating technique has to be the first technical priority to achieve thin electrolyte layers without processing defects.

Comparison of Solution-Based Processing Techniques Used for the Production of Thin YSZ Electrolyte Layers and Corresponding Cell Performances
10. Summary
With the advent of new materials and refined cell configurations, SOFCs have gone through numerous technical evolutions, facilitating their widespread commercialization in various application fields. According to cost analysis, the material cost makes up about 80% of the stack manufacturing cost, while the cell cost makes up about 50% of the stack cost at all production volume. Cost reduction efforts have been made though the adoption of thinner cells and stack components, higher level of manufacturing automation, and in-line quality assurance with particular emphasis on the improvement of production yield and power density. In this context, it is worthwhile to re-examine some of previous studies from the standpoint of powder packing and constrained sintering of composite cathodes and thin electrolyte layers.
Studies performed in the field of ceramic processing science have demonstrated that engineering reliability is a matter of processing reliability. Various outstanding achievements made in the field of SOFCs must be systematically supported by efficient processing for successful entry into the commercial market. Powder processing is considered the most efficient method to produce ceramics; however, multiple processing steps can lead to the introduction of heterogeneities. Moreover, we have re-evaluated the optimum compositions of composite cathodes reported in previous investigations using the bimodal packing model. We find that the considerable variation in the optimum compositions originate from the different packing behaviors of powders in the consolidation processes. This reconfirms that the initial mixing homogeneity of the dispersion structure must be maintained and reproduced in the particle packing structure to achieve a uniform microstructure with excellent engineering and processing reliability.
The development of bimodal packing structures by introducing slow-sintering nanoparticles into chemical solutions provides an exceptional opportunity to produce gas-tight electrolyte thin films on porous substrates without major defects. The structural integrity of electrolyte thin films deposited on porous substrates can be guaranteed if the film thickness is greater than the grain size of the electrolyte layer and pore size of the substrate. The grain size, which is greatly affected by the volume fraction of slow-sintering nanoparticles, determines the nanoparticle cluster structure and rigidity. A modified bimodal packing model (1D) can be used to explain the formation of uniaxial clusters and rigidity of the clusters with low coordination numbers. Moreover, controlling the lateral interaction between uniaxial clusters of slow-sintering nanoparticles appears to be the most critical parameter to achieve flaw suppression and controlled grain growth. Finally, a continuous manufacturing technology must be designed and developed for SOFCs to achieve economic competitiveness against other types of fuel cells, which eventually can become a cost-effective technology in energy conversion and storage fields.
Acknowledgments
This work was supported by the Korea Institute of Energy Technology Evaluation and Planning (KETEP), a granted financial resource from the Ministry of Trade, Industry & Energy, Republic of Korea (No. 20173010032140), and the institutional research program of the Korea Institute of Science and Technology.