Dispersion Characteristics of α-Fe2O3 Nanopowders Coated with Titanium Dioxide by Atomic Layer Deposition
Article information
Abstract
A TiO2 nanofilm was deposited on α-Fe2O3 nanopowders using the atomic layer deposition method. The TiO2 film was prepared at 300°C using Ti(N(CH3)2)4 and H2O as the precursor and reactant gas, respectively. The thickness and composition of the TiO2 surface were characterized by TEM and EDS measurements. The TEM results showed that the growth rate of the film was about 0.12 Å/cycle. The EDS and SAED analyses showed the presence of titanium oxide on the surface of the α-Fe2O3 nanopowders, confirming the deposition of the TiO2 nanofilm. The Zeta potential and sedimentation test results showed that the dispersibility of the coated nanopowders was higher than that of the uncoated nanopowders. This is attributed to the electrostatic repulsion between the TiO2-coated layers on the surface of the α-Fe2O3 nanopowders. The results revealed that the TiO2-coated layers modified the surface characteristics of the α-Fe2O3 nanopowders and improved their dispersibility.
1. Introduction
Magnetic nanopowders play a key role in drug delivery, magnetic resonance imaging and new generation of high-density magnetic recording media.1–3) Hence, iron oxide-based magnetic nanopowders such as Fe3O4 and Fe2O3 (α-Fe2O3, γ-Fe2O3) are being studied extensively.4–7) Iron oxide nanopowders have gained immense attention in the fields of biotechnology and medicine owing to super-paramagnetic characteristics. However, to be used in these fields, iron oxide nanopowders should satisfy the following requirements: uniform shape and size, resistance to aggregation, chemical stability and super-paramagnetism.8,9) Various studies are being conducted to meet these requirements and to solve the aggregation problem of iron oxide nanopowders. Research to reduce agglomeration of iron oxide nanopowder used as MRI contrast enhancement.10) A previous study has reported that the dispersion and magnetic properties of iron oxide nanoparticles can be controlled by controlling their average particle size.11) Another study has reported that the dispersibility of spherical iron oxide nanoparticles can be improved by coating silica on their surface.12) There have been reports on the fabrication of polymers with uniformly distributed magnetic iron oxide nanoparticles.13)
In this study, we improved the dispersibility of α-Fe2O3 nanopowders by coating chemically stable TiO2 on their surface via atomic layer deposition (ALD). The thickness of the TiO2 thin film-coated α-Fe2O3 nanoparticles was measured and their diffraction pattern was obtained. We also investigated the effect of the thickness of the TiO2 thin film on the dispersion characteristics of α-Fe2O3 nanoparticles.
2. Experimental Procedure
The α-Fe2O3 nanopowders used in this study were 99.5% pure and had an average particle size of 30 nm (Hefei Quantum Quelle Nano Science & Technology). The TiO2 thin films were fabricated by ALD. Ti(N(CH3)2)4(TDMAT) was used as the Ti source and H2O was used as the reaction gas. Inert Ar gas (6N) was purged into the system. In addition, a vertical flow-type reactor was used in our previous work14) to efficiently deposit TiO2 on the α-Fe2O3 nanopowders. The precursor of Ti(N(CH3)2)4(TDMAT) was delivered from a stainless steel container with the carrier of Ar at 70°C. The delivery lines were maintained at 70°C to prevent condensation of TDMAT inside the lines. The reactor temperature and the working pressure in the reactor were approximately 300°C and 1 torr, respectively. H2O was used as a reactant gas and Ar was used as a carrier and purge gas. The opening and closing sequences of the air valves were controlled by using a computer. The ALD process consisted of a given number of identical cycles. The TiO2 film thickness was controlled by varying the number of ALD cycles.
The surface of the α-Fe2O3 nanopowders was characterized by transmission electron microscopy (TEM, JEM-2100/JEOL). In order to confirm the presence of Ti, the resulting film was analyzed by energy dispersive spectroscopy (EDS, Oxford-INCA). Selected area electron diffraction (SAED) pattern analysis was carried out to determine the exact composition of the coated film. In addition, a zeta potential and particle size analyzer (Zeta-PSA, ELSZ/Photal) was used to evaluate the dispersibility of the coated α-Fe2O3 nanopowders. 0.006 g of α-Fe2O3 nanopowders was diluted in ethanol and then their sedimentation was monitored.
3. Results and Discussion
3.1. Changes in the surface of α-Fe2O3 with the number of ALD cycles
The thickness of the TiO2 layer deposited on the α-Fe2O3 nanopowders was determined from the TEM results. It was observed that the thickness of the coated layer increased with an increase in the number of ALD cycles. The TEM images are shown in Fig. 1. Fig. 1(a) shows the TEM image of the uncoated α-Fe2O3 nanoparticles, while Fig. 1(b) shows the TEM image the TiO2-coated α-Fe2O3 nanoparticles when the deposition was carried out for 200 cycles. In Fig. 1(a), the brighter part corresponds to the carbon film of the TEM grid used for preparing the TEM samples and the darker part corresponds to the α-Fe2O3 nanoparticles. In Fig. 1(b), the edge of the α-Fe2O3 nanoparticles (the interface between bright and dark portions) is the TiO2 thin film deposited by the ALD method.
TEM images of (a) uncoated α-Fe2O3 nanopowders, (b) TiO2-coated α-Fe2O3 nanopowders obtained after 200 ALD cycles.
Figure 2 shows the graph of the thickness of the deposited film (as measured from the TEM image) as function of the number of cycles. From this graph, the deposition rate was found to be ~0.12 Å/cycle.

Growth rate as a function of the number of ALD cycles.
The results of the EDS analysis of the thin films produced using different number of ALD cycles (0, 50, 100, 150, and 200 cycles) are given in the Table 1 from the EDS results, it was found that the uncoated α-Fe2O3 (0 cycles) nanopowders did not show any Ti peak. However, all the coated samples (50, 100, 150, and 200 cycles) showed Ti peaks. With an increase in the number of ALD cycles, the amount of Ti (in at%) coated on the surface of the α-Fe2O3 nanopowders increased.
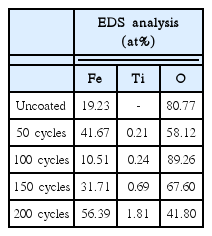
EDS Data of Uncoated and TiO2-Coated α-e2O3 Nanopowders
Figure 3 shows the SAED pattern of the uncoated α-Fe2O3 nanopowders (Fig. 3(a)) and TiO2-coated α-Fe2O3 nanoparticles obtained after 100 ALD cycles (Fig. 3(b)). From Fig. 3(a), the d values were measured to be 2.6952, 2.2937, and 1.8373 Å and corresponded to the (121), (222), and (220) planes of rhombohedral α-Fe2O3, respectively (JCPDS card No. 85-0599). From Fig. 3(b), the d values of 2.6543, 1.9384, and 1.5182 Å corresponding to the (110)/(130), (222)/(230), and (132)/(151) planes of α-Fe2O3/orthorhombic TiO2 respectively (JCPDS card No. 82-1123). Thus, it was confirmed that TiO2 with orthorhombic structure was deposited on the surface of α-Fe2O3 nanopowders.
SAED patterns (a) uncoated α-Fe2O3 and (b) TiO2-coated α-Fe2O3 obtained after 100 ALD cycles.
3.2. Zeta potential as a function of the number of ALD cycles
The zeta potential of the TiO2-coated α-Fe2O3 nanopowders obtained after 50 - 200 ALD cycles is shown in Fig. 4. The zeta potential was dependent on the number of ALD cycles and was found to be ranging from −10.51 (for 50 cycles) to −27.48 mV (for 200 cycles). The absolute value of the zeta potential of TiO2-coated α-Fe2O3 was 12.03 – 18.12 mV greater than that of uncoated α-Fe2O3. Therefore, it was confirmed that the charge on the α-Fe2O3 nanopowders increased with an increase in the number of ALD cycles. This means that the dispersion stability of α-Fe2O3 improved with an increase in the electrostatic repulsion between the α-Fe2O3 particles due to the increase in the charge of coated α-Fe2O3.14,15)

Zeta potential of the uncoated α-Fe2O3 nanopowders and TiO2-coated α-Fe2O3 nanopowders obtained after various ALD cycles.
3.3. Sedimentation change with the number of ALD cycles
The variation in the sedimentation characteristics of the TiO2-coated α-Fe2O3 nanopowders with the number of ALD cycles was analyzed. For the sedimentation test, 0.006 g of α-Fe2O3 nanopowders was diluted in ethanol and dispersed by ultrasonic waves. Fig. 5 shows the sedimentation characteristics of the TiO2-coated α-Fe2O3 nanopowders at different time intervals (1 h, 6 h, 16 h, and 3 days). It was found that the dispersion characteristics of the uncoated α-Fe2O3 sample and the coated sample obtained after 50 cycles deteriorated gradually as the sedimentation duration was increased beyond 6 h. As a result, the dispersion properties of these samples were lost after 3 days. This caused the precipitation and aggregation of the particles. The coated samples obtained after 100 – 200 ALD cycles showed good dispersion characteristics. In addition, it was found that the coated samples obtained after 100, 150, and 200 ALD cycles maintained their dispersion characteristics even after a sedimentation time of 16 h. However, after 3 days, the coated sample obtained after 150 ALD cycles showed precipitation. On the other hand, the coated sample obtained after 200 ALD cycles showed a high dispersion stability. From these results, it is clear that the TiO2 coating prevented the aggregation of the α-Fe2O3 nanoparticles and improved their dispersibility.
Sedimentation behavior of (a) uncoated sample and TiO2-coated samples obtained after (b) 50, (c) 100, (d) 150, and (e) 200 ALD cycles.
4. Conclusions
In order to prevent the agglomeration of α-Fe2O3 nanopowder particles, a TiO2 thin film was coated on their surface by ALD. The TiO2 coating produced an electrostatic repulsive force between the α-Fe2O3 nanopowder particles band improved their dispersion stability. The dispersion stability of the coated samples increased with an increase in the thickness of the TiO2 coating. Hence, the TiO2 coating prevented the aggregation of the α-Fe2O3 nanopowder particles and improved their dispersibility.
Acknowledgments
This study was supported by a research fund provided by Kumoh National Institute of Technology.