Degradation Comparison of Hydrogen and Internally Reformed Methane-Fueled Solid Oxide Fuel Cells
Article information
Abstract
Anode supported solid oxide fuel cells (SOFCs), consisting of Ni+YSZ anode, YSZ electrolyte, and LSM+YSZ cathode, were fabricated and constant current tested with direct internal reforming of methane (steam to carbon ratio ~ 2) as well as hydrogen fuel at 800°C. The cell, operated under direct internal reforming conditions, showed relatively rapid degradation (~ 1.6 % voltage drop) for 95 h; the cells with hydrogen fuel operated stably for 170 h. Power density and impedance spectra were also measured before and after the tests, and post-test analyses were conducted on the anode parts using SEM / EDS. The results indicate that the performance degradation of the cell operated with internal reforming can be attributed to carbon depositions on the anode, which increase the resistance against anode gas transport and deactivate the Ni catalyst. Thus, the present study shows that direct internal reforming SOFCs cannot be stably operated even under the condition of S/C ratio of ~ 2, probably due to non-uniform mixture (methane and steam) gas flow.
1. Introduction
A solid oxide fuel cell (SOFC) is an eco-friendly power generator and it draws attention as the advanced distributed power generator and fixed-type power generator. SOFC operates at high temperatures between approximately 700°C and 1000°C and it can generate power using hydrogen fuel which is used generally as well as hydrocarbon Fuel. Such operating environment at a high temperature enables direct internal reforming of hydrocarbon on Ni-YSZ (yttria stabilized zirconia) cermet anode without additional catalyst and external reforming device, moreover SOFC is highly durable against CO and CO2 due to the characteristics of solid cells. Such unique advantage of SOFC enables simple configuration and high efficiency in terms of system.1) A commercial SOFC stack may operate using city gas or natural gas (methane concentration over 90%) after internal reforming process, and studies on performance and durability changes upon fuel processing have been extensively carried out recently.2–13)
City gas and purified bio gas consist of methane mostly and main processes of internal reforming of methane can be written as shown in (1) and (2), for steam reforming and (2) dry reforming, respectively.14)
The steam reforming is carried out in a high temperature environment over approximately 500°C and continuous heat supply is required for the reaction. In case of SOFC, heat required for reforming reaction can be supplied through its exothermic fuel cell reaction.15) When 1 mole of methane and 1 mole of steam supplied to the anode of SOFC (Ni particle surface) are converted into 3 moles of hydrogen and 1 mole of carbon monoxide, and this process accompanies +206 kJ/mol of endothermic reaction. The hydrogen and carbon monoxide are converted into H2O and CO2, respectively, by the electrochemical reaction of fuel cell combining with oxygen ion delivered from the cathode through the electrolyte, generating electricity and heat. In case of dry reforming, 1 mole of CH4 and 1 mole of CO2 react, producing 2 moles of CO and 2 moles of H2, and this process accompanies +261 kJ/mol of endothermic reaction. In addition, 1 mole of CO generated can be converted into 1 mole of CO2, generating 1 mole of H2 by the water gas shift reaction (3), even under open circuit condition. This process accompanies −42 kJ/mol of exothermic reaction. As a result, in case of steam reforming, 1 mole of CH4 can generate up to 4 moles of hydrogen, and eventually 4 moles of hydrogen can generate up to 8 moles of electron.
SOFC which enables direct internal reforming can simplify the system design and maximize efficiency but it also has several significant problems. First, since the internal reforming reaction is the endothermic reaction and it is rapidly carried out in front of the cell where the fuel is supplied first, a temperature difference on the cell becomes significant due to local cooling, leading to thermal stress (physical damages).1) It is known that such temperature difference becomes more significant as the current density is higher or as the fuel utilization is lower.16) Second, there is the carbon deposition issue due to pyrolysis of hydrocarbon.8) Generally, more amount of steam than as required for steam reforming in the ratio of 2 for the S/C ratio (steam to carbon ratio) is supplied to prevent the carbon deposition.17) The carbon deposition occurs on the surface of anode and interferes with the electrochemical reaction of anode, resulting in decrease in the performance and lifetime of SOFC consequentially. In the previous study, the initial power denisty and impedance on the methane internal reforming fuel condition were compared and analyzed with those on the hydrogen fuel condition, indicating that the initial performance could be comparable if the methane flow rate was supplied in consideration of moles of electron generated per 1 mole of fuel gas.18) In order to compare long-term durability according to two fuel conditions, hydrogen fuel and direct internal reforming of methane, the long-term constant current test was carried out in this study, and the microstructure and composition of anode were analyzed after the test in order to find out the causes for deterioration.
2. Experimental Procedure
2.1. Single cell fabrication
The anode supported solid oxide fuel cell used in this study is 25 mm in the diameter and 14 mm in the cathode diameter (active area) and it consists of 5 layers. The anode support (AS) was fabricated by mixing NiO and YSZ (TOSOH, 8 mol% Y2O3-doped ZrO2) powders in the ratio of 70 : 30 Wt%, applying the uniaxial compression molding and heat treatment at 950°C for 1 h. The anode functional layer (AFL) slurry was prepared by grinding and mixing NiO 60 Wt% and YSZ 40 Wt% using planetary ball mill. AFL was completed by drop-coating on the heat treated surface of AS with the prepared slurry and carrying out heat treatment at 950°C for 1 h. The surface of AFL was drop-coated with electrolyte slurry mixed with YSZ and butanol and then sintered at 1460°C for 4 h. The cathode functional layer (CFL, LSM (La0.8Sr0.2MnO3–ä) +YSZ) and the current collector (CC, LSM) were screen printed on the surface of the sintered electrolyte and then heat treated at 1170°C and 1160°C respectively.
2.2. Long-term test setup
For electrochemical tests, the cell were loaded on the specially designed test fixture for gas inflow, outflow and current collection, and its components are as follows: 1) alumina body, 2) ceramic sealant, 3) Ni mesh -Cu wire for anode current collection, 4) Pt mesh -Ag wire for cathode current collection 5) Anode/Cathode end plate consisting of 6 gas channels. A schematic diagram of the test fixture including an anode supported cell is as shown in Fig. 1, and the block diagram with the peripheral devices (humidifier, furnace and test equipments, etc) can be found in the reference.18) Gas conversion rate and electrochemical characteristics were measured both at 800°C. NiO anode was reduced by supplying mixed gas (H2 10%, N2 90%) for approximately 2 h, and then tests were conducted by supplying hydrogen gas (H2 ~ 400 cc/min or ~ 600 cc/min) and air (Air ~ 400 cc/min or ~ 600 cc/min) to the anode and cathode, respectively. In the condition for direct internal reforming of methane, the flow rate of methane was adjusted to a 1/4 level (CH4 ~100 cc/min) since up to 8 moles of electron could be generated per 1 mole of methane. Steam was supplied in S/C ratio ~ 2 using a humidifier (injection type), and heating was carried out on the gas inlet in order to prevent the occurrence of condensed water. The methane-hydrogen gas conversion rate by direct internal reforming was measured using gas chromatography, (GC, YL6500GC), and a separate cooler (steam trap) was installed on the outlet in order to remove steam from gas.
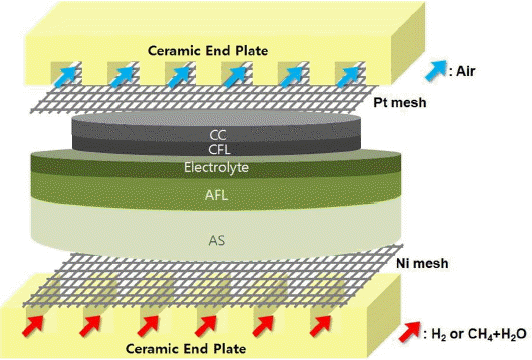
Schematic of the cell test setup.
In order to evaluate the long-term durability, constant current tests were carried out at 800°C for 170 h in case of hydrogen and for 95 h for direct internal reforming. The condition of gas supplied to anode and cathode was as shown above. Power density and impedance spectra were measured in order to compare performance change between before and after the constant current test. Note that hydrogen (400 cc/min) was used for these measurements (power density and impedance spectra ) regardless of fuel conditions during constant current tests.
After completing the long-term constant current test, the microstructure and composition of anode were analyzed using scanning electron microscopy (SEM) and energy dispersive spectroscopy (EDS).
3. Results and Discussion
3.1. Evaluation of internal reforming gas conversion rate according to the methane flow rate
Figure 2(a) and (b) show the GC results of methane-hydrogen gas conversion rate by direct internal reforming under the open circuit voltage, at 100 cc/min and 50 cc/min of methane flow rate, respectively. The outlet gas was analyzed on the condition of 800°C and S/C ratio 2. (a) showed approximately 89.6% conversion rate as 57.0% for H2, 9.6% for CH4, 24.1% for CO and 1.9% for CO2, indicating hydrogen and CO were generated through the steam reforming reaction. Since CO2 was also detected under open circuit condition in this experiment, it can be said that some of CO generated from steam reforming was converted into CO2 by the water gas shift reaction. Approximately 7.34% N2 peak was detected, resulting from incomplete gas sealing. (b) showed approximately 91.0% conversion rate as 57.5% for H2, 7.9% for CH4, 13.7% for CO and 9.0% for CO2. The reforming of methane occurs on the Ni catalyst of anode, so the gas conversion rate depends on the flow rate of methane supplied in comparison to the total surface area of Ni catalyst.16) Therefore, in case of 50 cc/min of methane, the conversation rate increased due to the decrease in the flow rate of methane. It is expected that the conversion rate will increase more with decreasing the flow rate of methane, and the use of methane fuel for direct internal reforming will show sufficient efficiency in comparison with hydrogen fuel, with respect to commercial fuel cells requiring the high fuel utilization. Since a similar conversion rate was measured from two flow rate conditions above, long-term fuel cell tests were carried on the same flow rate condition as shown in (a) in order to minimize the gas concentration and conversion overpotential.

GC results of internal reforming under open circuit condition (a) CH4 100 cc/min, (b) CH4 50 cc/min.
3.2. Durability evaluation (constant current test)
In order to evaluate the durability of SOFCs according to the fuel type, 2 button-type cells in the same composition were prepared and constant current tests were carried out under the direct internal reforming condition of methane and hydrogen, respectively. In our previous work, hydrogen and internally reformed methane fueled cells showed a comparable initial performance,18) but the performance of internally reformed methane fueled cell may be degraded in the long-term due to various complicated factors including the amount of steam supply, level of carbon deposition and inlet/outlet gas exchange, etc.19) At first, the constant current test (680 mA/cm2) corresponding to the cell voltage of ~0.8 V using pure hydrogen was carried out, and Fig. 3 shows the plot of cell voltage vs. time for 170 h under such condition. Note that the 70 h and 130 h sections correspond to open circuit condition, which was for replacing gas cylinder, and the flow rate of hydrogen and air increased to 600 cc/min after the 75 h section in order to maintain the cell voltage at ~ 0.8 V. There was a slight cell voltage rise and drop during the long-term test but a stable cell voltage was maintained overall. Fig. 4(a) and (b) show the measurements results of I–V and impedance, respectively, on the hydrogen condition before and after the test. Initially, the peak power density was 0.70 W/cm2, and it decreased to 0.65 W/cm2 by approximately 0.05 W/cm2 after the test. In other words, approximately 0.03 W/cm2 output per 100 h was reduced, indicating that decrease in performance was insignificant. Since there was no change in the ohmic resistance, corresponding to high frequency intercept of the arc on the real axis, it can be said that contact resistance and interfacial resistance of electrode/electrolyte did not increase. However, a slight increase in the arc size (non-ohmic resistance) was observed, especially in the frequency range > 10 Hz.
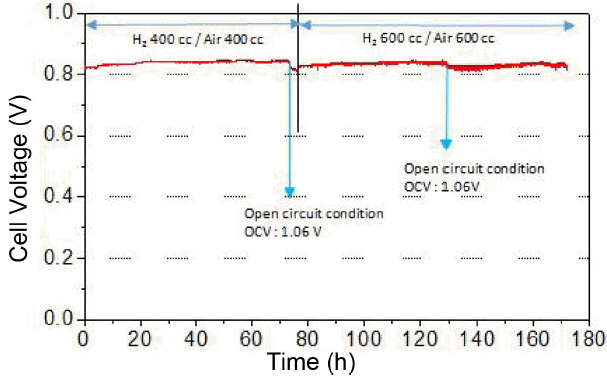
Plot of the cell voltage at 680 mA/cm2 vs. time with hydrogen fuel.

(a) I–V curves and (b) impedance spectra under open circuit, at hydrogen/air flow rate of 400 cc/min before and after the constant current (CC) test with hydrogen fuel.
The long-term constant current (195 mA/cm2) test using the direct internal reformed methane fuel was carried out for 95 h by applying the load corresponding to ~ 0.8 V of cell voltage (Fig. 5). The cell voltage fluctuation was observed continuously, and such phenomenon resulted from uneven steam supply and discharge. Such unstable voltage can be solved if the amount of steam supply is reduced and the condensed water generation is effectively prevented. Approximately 1.6% voltage drop over 95 h was calculated, indicating that the deterioration became more severe during internal reforming, in comparison with the hydrogen fuel condition. The I–V and impedance analysis before and after the constant current test were carried out, and the results are shown in Fig. 6(a) and (b), respectively. 0.81 W/cm2 of initial peak power density decreased significantly to 0.25 W/cm2 after the constant current test for 95 h, and a significant resistance increase was also observed from the impedance spectra. Similar to hydrogen fuel, methane fuel also showed no change in ohmic resistance before and after the constant current test, but non-ohmic resistance increase was observed, from 0.439 Ωcm2 to 1.076 Ωcm2, especially in the frequency range > 10 Hz related to activation overpotential and also in the frequency range < 10 Hz related to gas concentration/conversion overpotential.
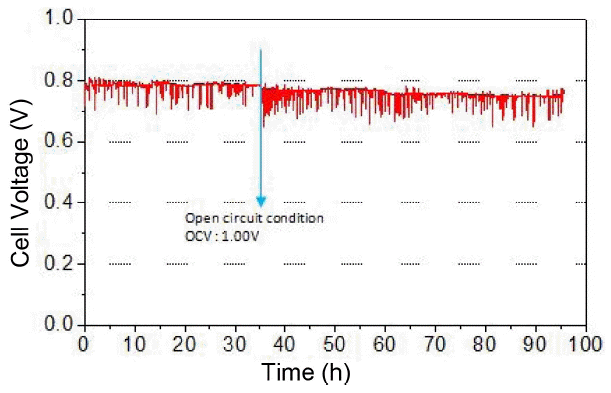
Plot of the cell voltage at 195 mA/cm2 vs. time with internal reforming of methane.
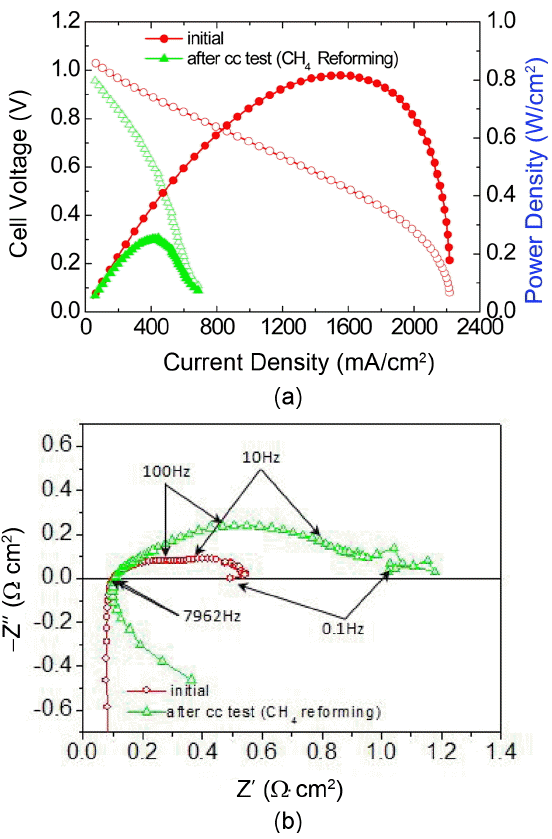
(a) I–V curves and (b) impedance spectra under open circuit, at hydrogen/air flow rate of 400 cc/min before and after the constant current (CC) test with internal reforming of methane.
Microstructural and elemental analyses were conducted on the anode of cell using SEM and EDS after the long term tests. Fig. 7(a) and (b) show the cross section of the anode support after the long-term tests with hydrogen and methane fuel, respectively. (a) shows the microstructure of typical Ni+YSZ cermet while (b) shows many regions where carbon is detected, showing a significant difference in the microstructure in comparison to (a). Although steam was supplied based on S/C ratio ~ 2 in order to prevent carbon deposition and also steam was additionally produced on the anode during fuel cell reaction, carbon deposition could not be prevented for a long period of operation time. The reason for this is likely that mixing and supplying of methane and steam in S/C ratio ~ 2 were not optimized, which eventually developed regions out of S/C ratio ~ 2. On the basis of the results of impedance and the post analysis, it can be explained that carbon deposited on the anode particle surface deactivates Ni deactivation as well as increases gas transport resistance through the anode layer. Therefore, a short-term performance of fuel cell consisting of Ni anode equivalent to the hydrogen fuel can be expected also on the internal reforming operating condition of methane, but long term durability may not be achieved with internal reforming of methane if the methane and steam supply design and process are not optimized.
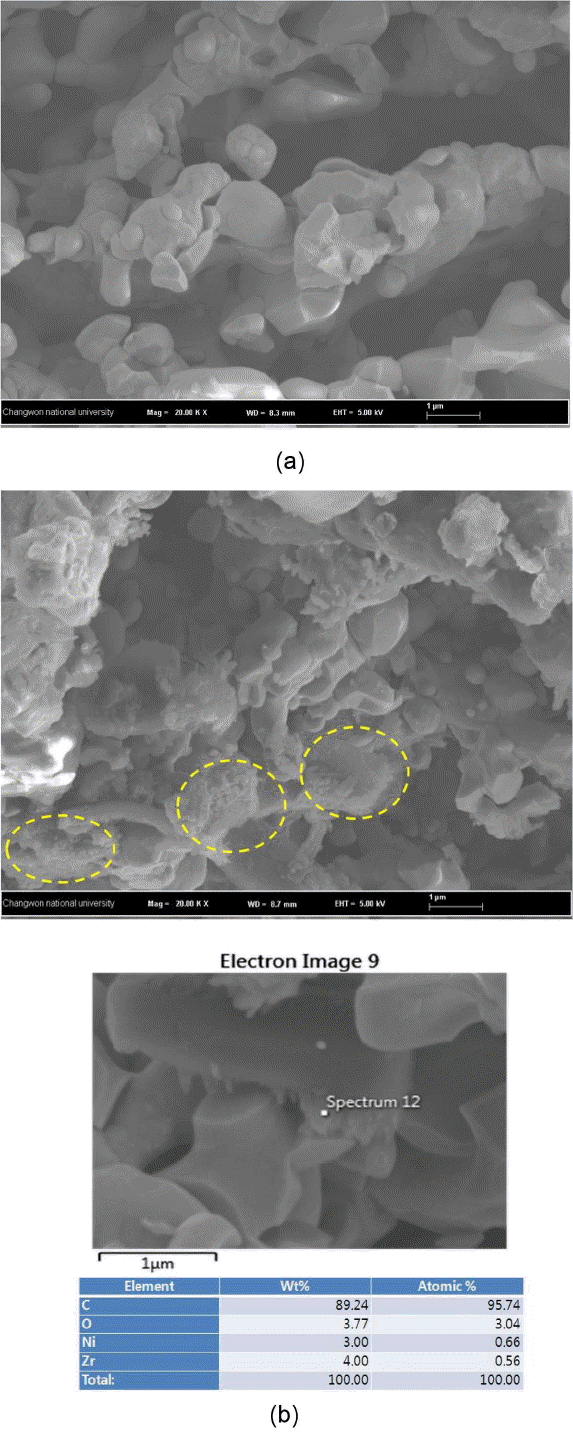
SEM images of the cross section of the anode support after the CC test: (a) with hydrogen fuel, (b) with internal reforming of methane.
4. Conclusions
The durability test of anode supported cell was carried out at 800°C using two kinds of fuel, the hydrogen and methane respectively (internal reforming, S/C ~ 2). First of all, the methane-hydrogen gas conversion rate was measured using GC under direct internal reforming condition, and the result indicated that the conversion rate increased slightly as the flow rate of methane decreased. Long term tests were conducted on the hydrogen and internally reformed methane fueled cells. The former showed almost no voltage drop occurred in the constant current test for 170 h while voltage fluctuation and approximately 1.6 % voltage drop occurred on the latter for 95 h. As a result of impedance analysis before and after the long term test on the cell with internal reforming of methane, there was no change in ohmic resistance while non-ohmic resistance significantly increased in the frequency range dominated by activation and gas concentration/conversion overpotential. As a result of post-material analysis using SEM and EDS, carbon deposition was detected on the anode particle surface. In other words, the deterioration of methane fueled cell occurred, attributing to the deactivation of Ni anode and the increased resistance for anode gas transport through the anode layer. Therefore, the present work shows that the performance deterioration may occur due to carbon deposition even under S/C ~ 2 condition unless the methane and steam supply design and process are not optimized.
Acknowledgments
This research is financially supported by Changwon National University in 2015~2016.