


1. Introduction
SiC-based ceramic matrix composites (CMCs) exhibit excellent fracture toughness, high strength, and excellent oxidation/ablation resistance at high temperatures1,2) and have been intensively investigated for structural components like shrouds, vanes and blades for aerospace applications.3) The excellent mechanical properties of CMCs can be mainly attributed to the energy absorption at the interface between the fiber and the matrix, which is induced by various mechanisms such as crack deflection, bridging, and pull out of the fibers. Therefore, the fiber/matrix interface should exhibit an optimum bonding strength with low shear strength at the operating temperature. The bonding strength between the fiber and the matrix can be controlled by adjusting the thickness and/or microstructure of the interface layer.4,5) Pyrolytic carbon (PyC) with low bond energy along c-axis is mainly deposited as the interface layer via chemical vapor deposition using methane or propane as the precursors.
The crystal structure of PyC layers depends on the deposition conditions such as temperature, pressure, residence time, and flow rate.6) In most of the cases, the layers show a turbostratic structure, which is unfavorable for applications in structural components.7) Controlling the microstructure of the PyC layer in CMCs is one of the major technical issues in CMC. Lieberman et al. classified the crystal structure of PyC layers as: rough laminar (RL), smooth laminar (SL), and isotropic (ISO) on the basis of their extinction angles determined using a polarization light microscope.8) Vallerot et al. reported that the classification of PyC is controversial because of the use of inappropriate tools for examining the PyC structure and proposed a two-dimensional diagram to differentiate the regenerative laminar structure from RL with the aid of both structural and textural parameters obtained through Raman and transmission electron microscopy (TEM) analyses, respectively.9) Meadows et al. used selected area diffraction patterns (SAEDPs) to classify the microstructure of PyC layers as low-texture (LT), medium-texture (MT), and high-texture (HT).10) SiC-based composites with anisotropic PyC structures exhibit improved mechanical properties such as toughness and strength.11-14)
In this study, we carried out the microstructural control of PyC layers deposited using methane as the raw material and quantified their degree of anisotropy using Raman spectroscopy, X-ray diffraction (XRD), and TEM.
2. Experimental Procedure
2.1. Infiltration conditions
The carbon fiber preforms used in this study were manufactured in Daeyang (Daeyang Industries Co., Ltd, Korea, Korea). The needle-punched (2.5D) preforms had a diameter of 50 mm, thickness of 10 mm, and density of 0.45 g/cc. The PyC layers were deposited in an isothermal chemical vapor infiltration system equipped with a dry pump and MFCs. The inlet structure near the hot zone has been described elsewhere.15) The precursors for the PyC layers were hydrogen gas and methane (5% and 100%). The temperature was fixed at 1200°C and the pressure of the reactor was maintained at 10 Torr using a throttle valve and a capacitance-diaphragm-gauge. The flow rate of the precursors was 300 sccm and the residence time calculated from the estimated hot zone was 1.3 s.
2.2. Structural characterization
The preforms were cut into small slices (10 mm × 3 mm × 1 mm). The thickness of the PyC layers was determined using a scanning electron microscope (JSM-6390, JEOL, Japan). The preforms were pulverized in an agate mortar and were then sieved with a 325-mesh screen to measure the crystallinity of carbon using XRD (D/MAX 2500, Rigaku, Japan). The powders were mixed with a standard silicon powder and the 2θ range and scan speed used for the measurements were 20-30° and 1°/min, respectively. A divergence slit of 1/2°, scattering slit of 1/2°, and receive slit of 0.15 mm were used to reduce the signal-to-noise ratio.16)
A transmission electron microscope (Tecnai G2 F30 S-Twin, AP Tech, USA) with a point-resolution of 0.2 nm was used to examine the carbon anisotropy of the layers. The inter-planar spacing and orientation angles (OAs) of the PyC layers were determined from their radial intensity profiles and their azimuthal projection with the fast Fourier transformation (FFT) of the corresponding high-resolution TEM (HRTEM) images using the method reported by Seyring et al..17) A Raman spectrometer (Renishaw, UK) was used to characterize the carbon arrangement of the PyC layers. The power of the laser was maintained at < 0.5 mW to avoid heating of the specimen.
3. Results and Discussion
3.1. Microstructure of the PyC layers deposited on carbon preforms
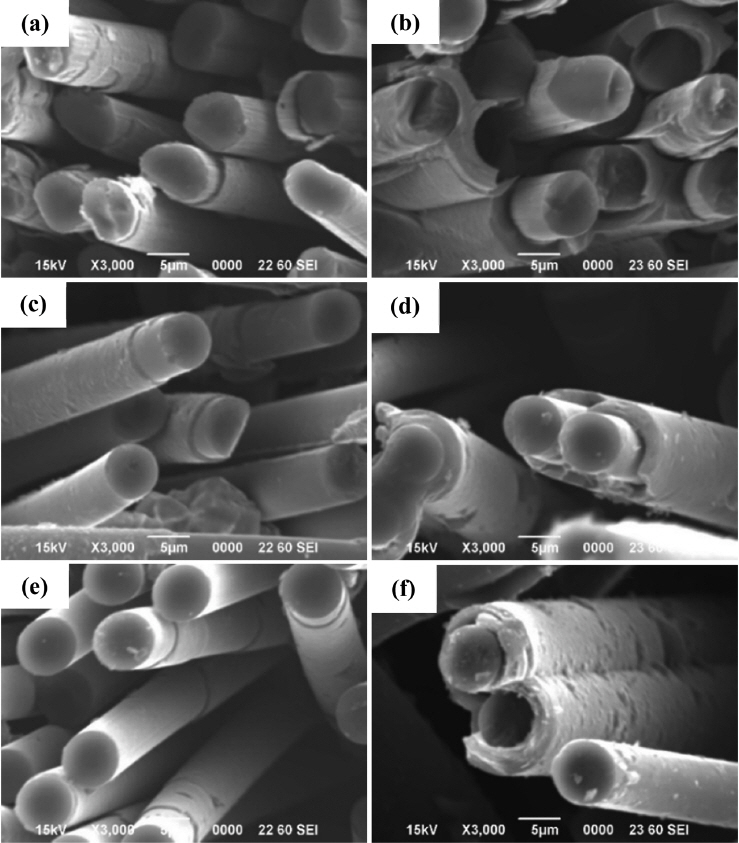
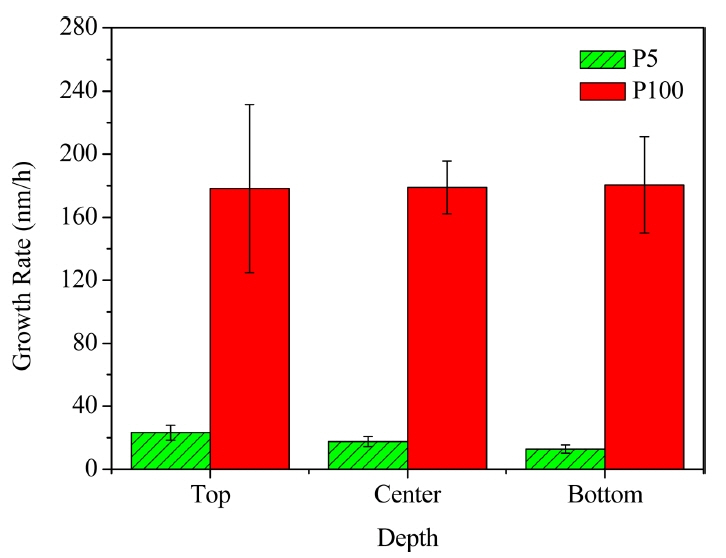
The PyC specimen deposited using 5% CH4 and 95% H2 was labelled as ‘P5’, while that deposited using 100% CH4 was labelled as ‘P100’. The microstructural examinations of P5 and P100 revealed that the preforms were uniformly covered with PyC (Fig. 1). The preforms could be easily penetrated by methane without blocking the surface because of its high enthalpy of formation and high diffusivity.18) The growth rates of the PyC layers were calculated from their scanning electron microscopy (SEM) micrographs by determining their thickness at 20 spots, as shown in Fig. 2. The growth rate of P100 was 8-12 times higher than that of P5 because of its higher methane concentration. According to Bammidipati et al., high hydrogen concentrations can reduce the growth rate of PyC layers.19) P100 showed uniform thickness (irrespective of the position) as compared to P5. This indicates that the concentration of CH4 showed a gradient from the top to the bottom in the case of P5, where the overall reaction was controlled by the diffusion of CH4. On the other hand, P100 showed a uniform methane concentration because its overall reaction was controlled by the surface decomposition of CH4.20)
3.2. XRD analysis of the pulverized powders
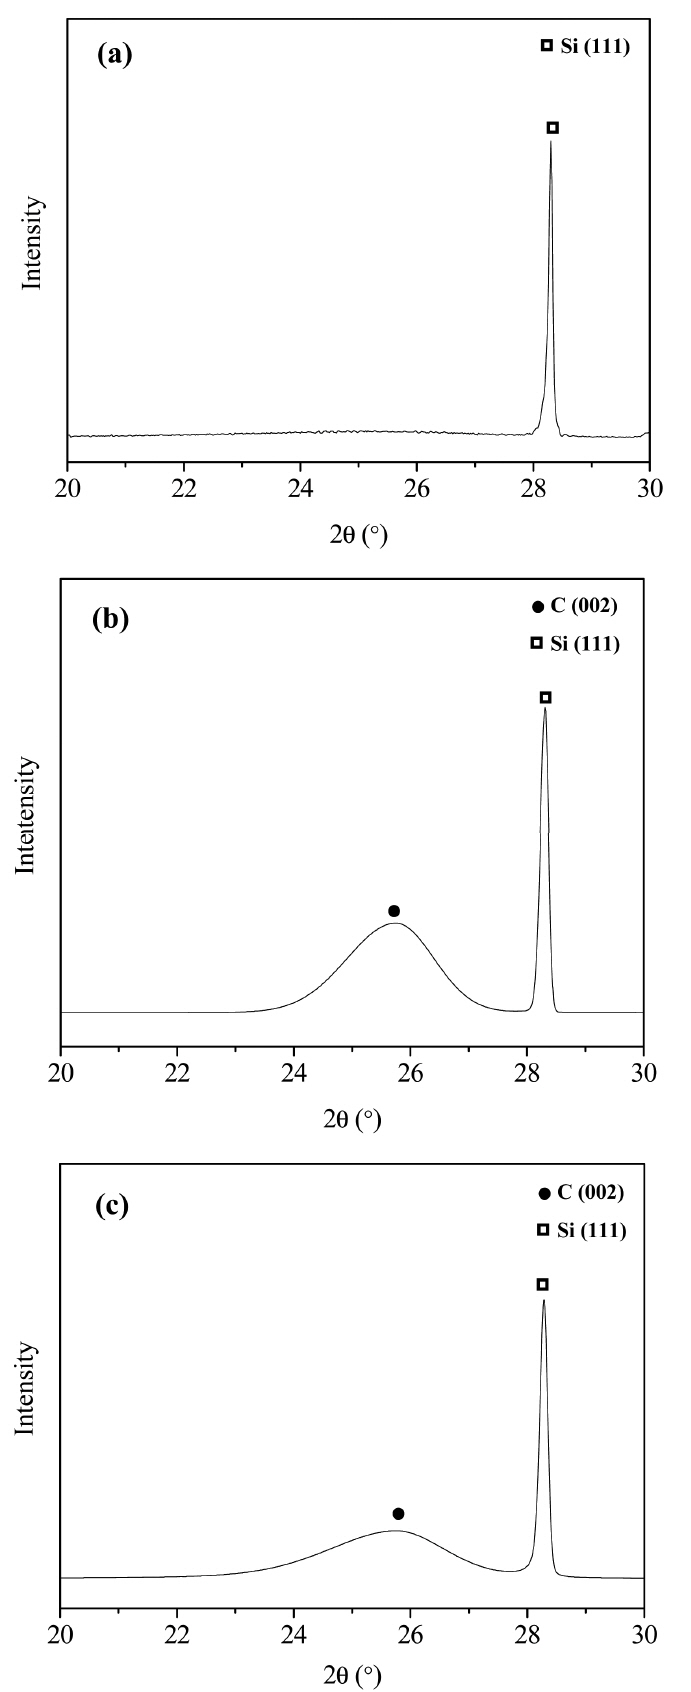
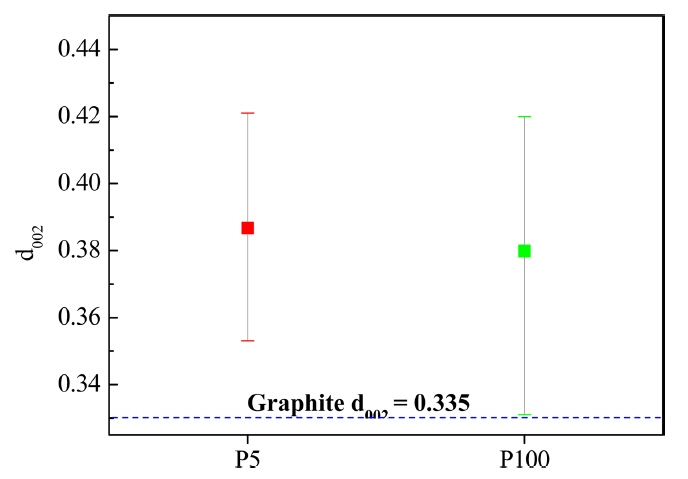
XRD analysis of the pulverized PyC powders was carried out to examine their crystallinity. The XRD patterns showed no crystalline phase, as shown in Fig. 3(a). The d002 of P5 and P100 was 0.345 nm, which is higher than that of ideal graphite.21) This indicates that the turbostratic structure of the PyC layers was formed by the generation of stacking disorders during the chemical vapor deposition growth.17) The crystal sizes of P5 and P100 were calculated using the Scherrer equation and were found to be 4.87 and 3.59 nm, respectively.22) The measured full-widths at half maximum (FWHMs), asymmetric factors, and crystallite sizes of the PyC layers are listed Table 1. The asymmetric factors, which increase with the generation of stacking faults,23) of P5 and P100 were calculated to be 1.27 and 1.4, respectively. With a decrease in FWHM values and asymmetric factors, defects like stacking faults also decrease. Thus, P5 exhibited more ideal crystal structure than P100.
3.3. TEM analysis
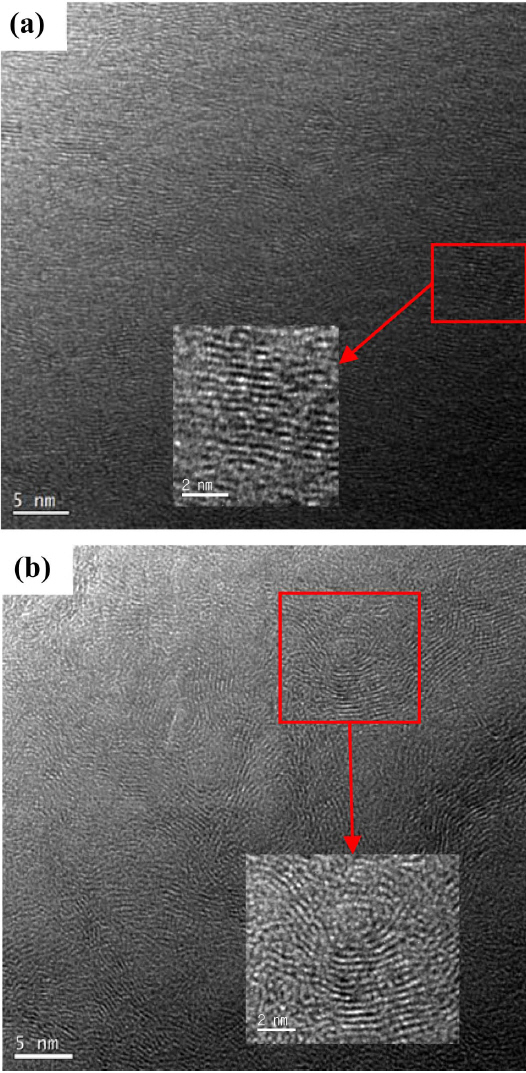
The HRTEM images of P5 and P100 with their (002) planes are shown in Fig. 4. The rectangular region exhibiting the (002) plane in Fig. 4(a) was magnified to examine its anisotropy. In the PyC layers, 15 rectangles were selected and the average distances of the (002) planes and their standard deviations were measured (Fig. 5). On the other hand, the T100 planes were curved and tortuous like a bump, as shown in Fig. 4(b). The average d002 values and their standard deviations are also shown in Fig. 5. Because of the loss of anisotropy, the deviations increased while the average d002 values remained constant. The formation of bumps can be attributed to the generation of a large number of nuclei in the gas phase, as suggested by Bourrat et al..22)
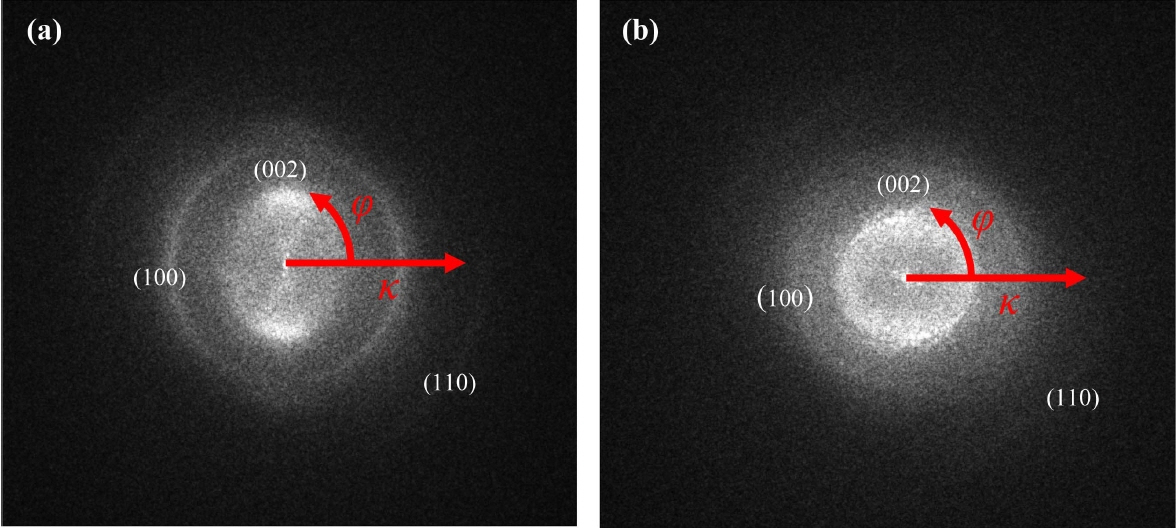
The FFT technique is the most productive method for determining the crystal structure of a material as it can be applied to band-pass filtering and noise filtering in the reciprocal lattice space. The FFT of a material can be obtained by using the Fourier transform of its HRTEM image. FFT images are the same as SAEDs and can also be used for crystal structure analysis. This technique allows the extraction of diffraction patterns in various regions of interest such as grain boundaries and the areas having a large number of atomic defects and well-aligned atomic arrangements.24) These two-dimensional patterns of graphene layers provide information about various structural parameters such as the orientation, interplanar distance, and curvature. Each Bragg diffraction point represents a specific interplanar distance and orientation. The distance between the center point and the reciprocal lattice space is referred to as the interplanar distance. Hence, the quantitative crystallographic analysis of specific areas can be carried out using these methods. As mentioned earlier, the statistical evaluation of the lattice parameters and crystal orientations of the PyC layers could be carried out using the FFT images shown in Figs. 4(a) and 4(b). As shown in Figs. 6(a) and 6(b), the turbostratic structure of the PyC layers consisted of not only the (002) planes but also the (100) and (110) planes, which is a characteristic of crystalline graphite.17) The (002) planes of P5 showed anisotropy, while those of P100 showed an isotropic ring pattern.
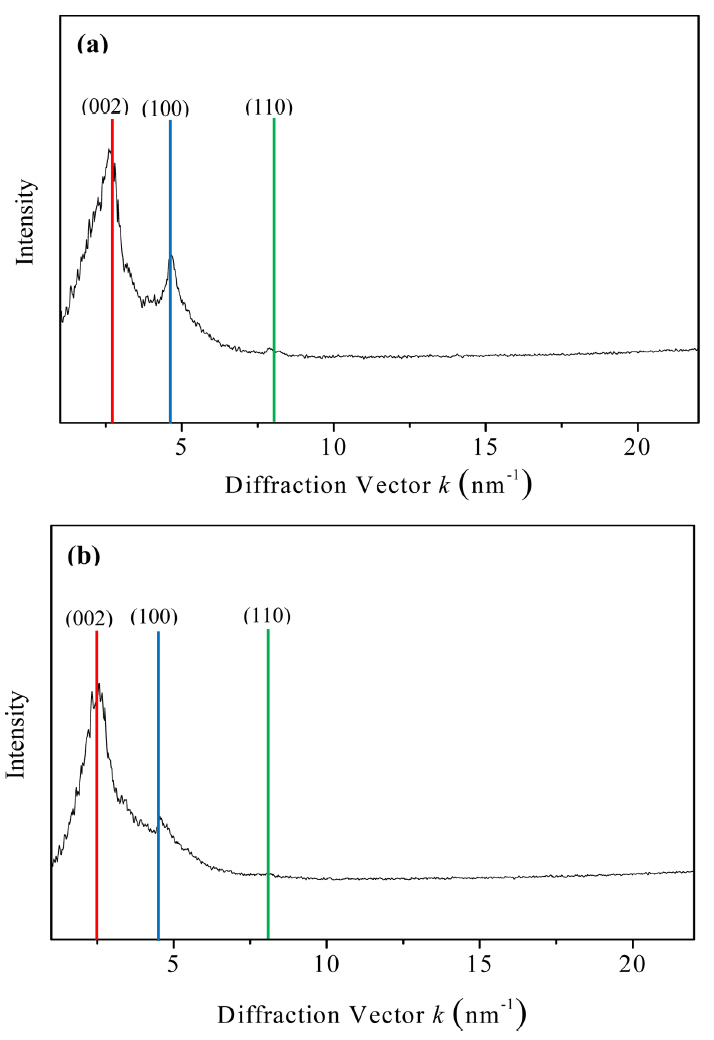
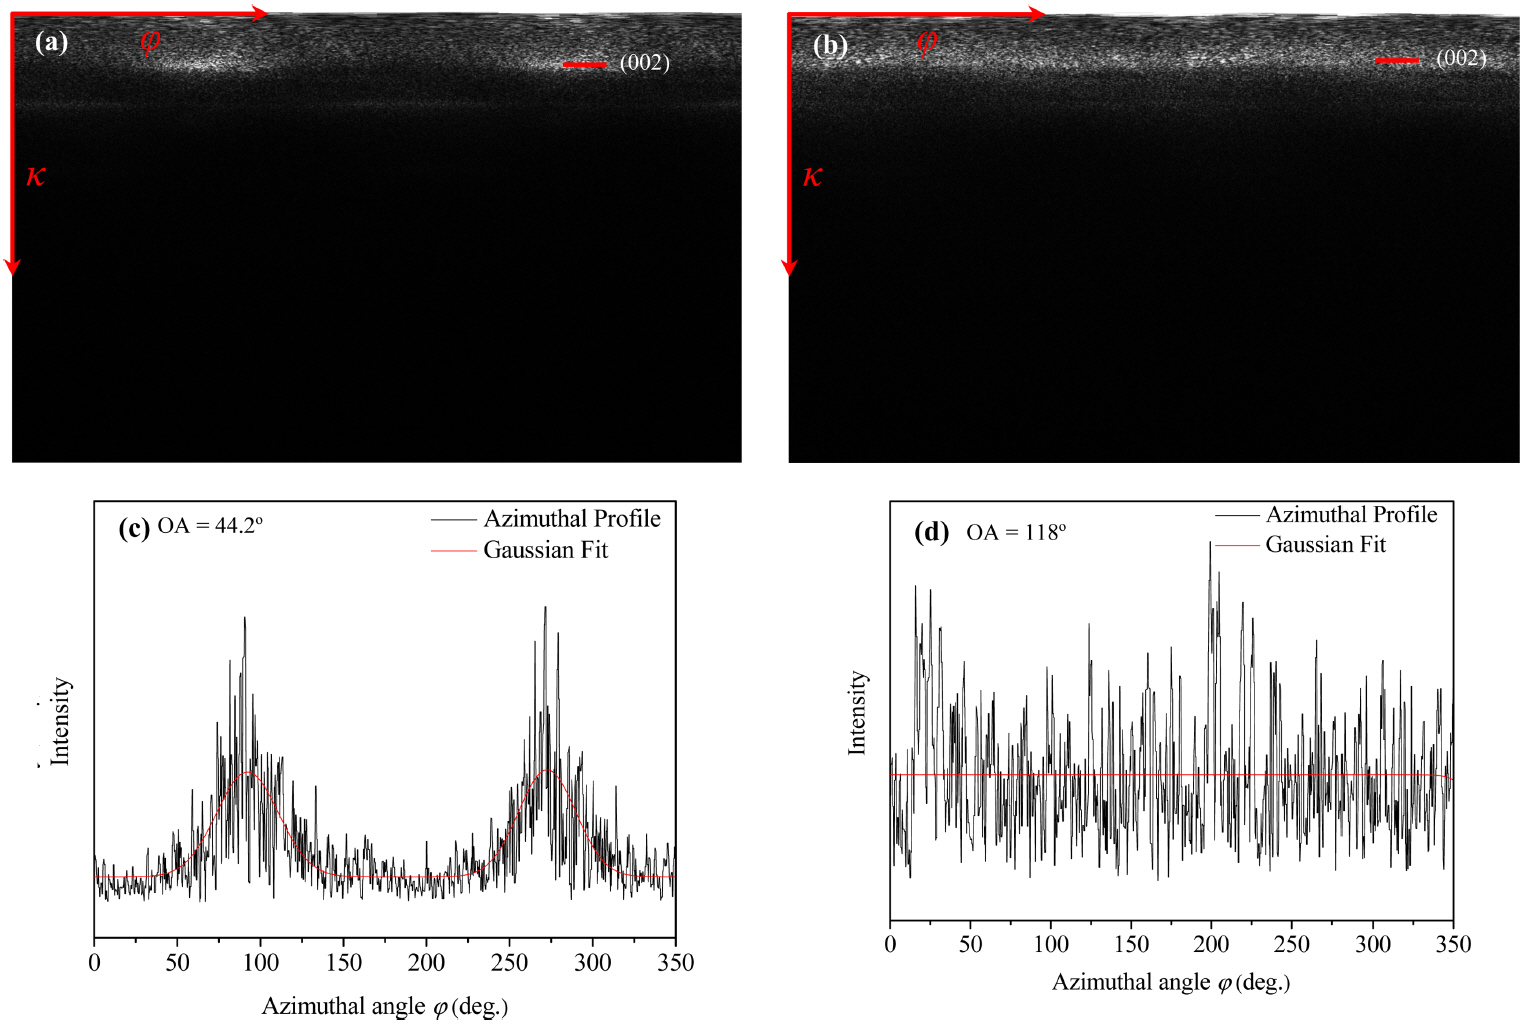
FFT images can be used for crystallographic analysis. This analysis can be carried out by determining the polar coordinates of FFT images. The coordinates of FFT images can be expressed by their diffraction vector, κ, as radial coordinates and azimuthal angle, ϕ, as shown in Fig. 6. The average intensity of the azimuthal angle with respect to the diffraction coordinates can be extracted using the FFT coordinates i.e., the interplanar distance. The azimuthal projection can also axially deform κ and ϕ into two-dimensional planes, and the intensity can be determined by carrying out horizontal integration on each plane. The radial intensity curve shown in Fig. 7(a) showed sharp (100) and (110) peaks, while that in Fig. 7(b) showed small and broad (100) and (110) peaks. This indicates that P5 deposited with high texture, while P100 deposited with low texture.17) The interplanar distances of P5 and P100, as calculated from Fig. 7 under the assumption of Gaussian peaks, are listed in Table 2. Unlike P100, P5 showed lattice parameters comparable to those of graphite. This indicates that P5 is suitable for improving the toughness of CMCs owing to their good mechanical properties. The OAs of the layers were calculated by plotting the data shown in Fig. 6 to extend the intensity along the azimuthal angle of the (002) planes, as shown in Fig. 8. By comparing the azimuthal profiles of the layers with the normal ones under the Gaussian distribution of peaks, as shown in Figs. 8(c) and 8(d), the OAs of P5 and P100 were measured to be 44.2 and 118°, respectively.
3.4. Raman spectroscopic analysis
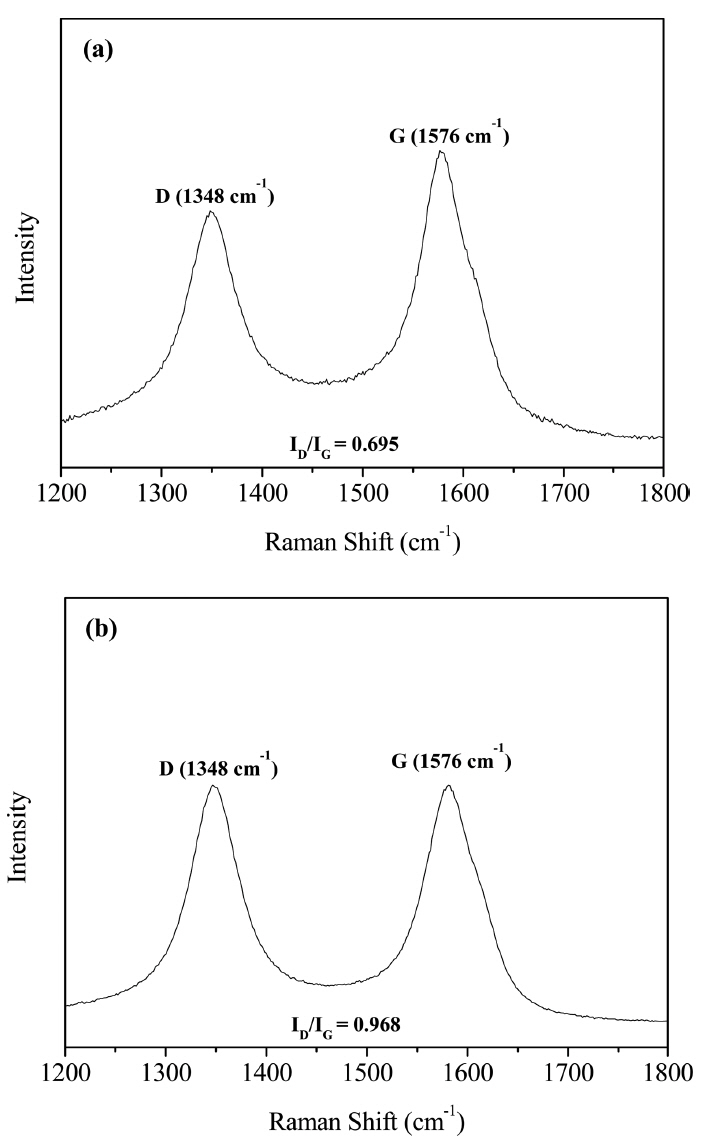
Raman spectroscopy is widely used for investigating the bonding characteristics of carbon materials owing to its nondestructive nature and high sensitivity.25) The Raman spectra of carbon materials show their G and D peaks.25,26) The G peak corresponds to the on-plane mode of phonon absorption at 1576 cm−1, which is a characteristic of sp2 carbon bonding. On the other hand, the D peak is corresponds to sp3 carbon bonding and is a characteristic of graphite. Hence, the D peak of PyC reflects the concentration of defects, and the ID/IG ratio graphite-related materials is a measure of their atomistic perfection.25) In order to compare the crystallinity of P5 and P100, their Raman spectra were recorded, as shown in Fig. 9. The ID/IG ratios of P5 and P100 were measured to be 0.695 and 0.968, respectively. This indicates that P5 showed higher crystallinity than P100.
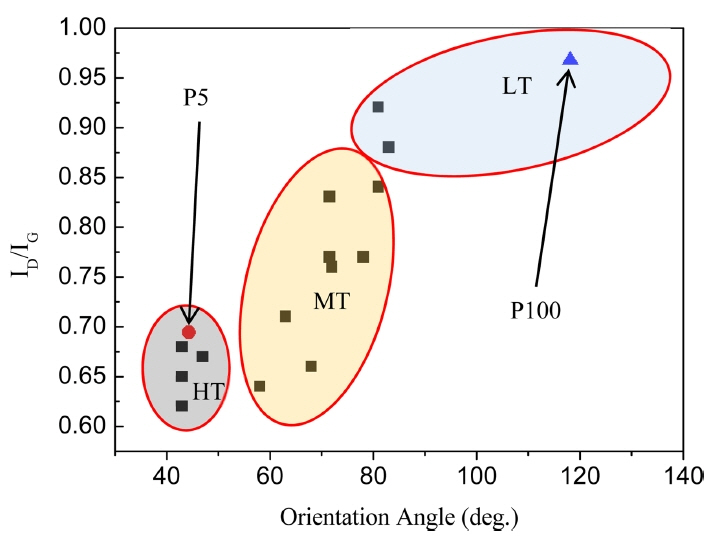
According to Meadows et al., depending on their ID/IG and OA, PyC layers can be classified as: HT, MT, and LT (Fig. 10).10) P5 and P100 were found to be HT and LT, respectively. The low methane concentration of P5 contributed to its HT structure and idealistic inter-layer microstructure. Such PyC layers show highly anisotropic inter-layers and can be applied for developing CMCs with high toughness.
4. Conclusions
CMCs are ceramic-based materials and are used for developing highly reliable aerospace components since they can withstand high temperatures of about 1300°C in air.27) In this study, we deposited anisotropic PyC layers with 5% and 100% methane and investigated their characteristics using HRTEM, XRD, and Raman spectroscopy. The layers showed high toughness, which is desirable for developing CMCs for aerospace applications.28) Efforts are being made to optimize the thickness of PyC layers for developing CMCs with improved properties.