


1. Introduction
In recent years, a significant amount of research has been devoted to creating inorganic nanocrystals owing to their potential for application in biology, electronics, optics, transport, and information technology. Several approaches have been proposed to manufacturing these nanocrystals and to control their size, shape, and crystallinity.1-8) However, a variety of factors influencing the shape and size of these materials still need to be identified. Synthetic ceramic materials based on calcium phosphates (CaP) have been extensively studied and clinically used, particularly in compositions of tricalcium phosphate [TCP: Ca3(PO4)2] and hydroxyapatite [HA: Ca10(PO4)6(OH)2].9-18) For three decades, research in biomaterials has focused on the synthesis of these bioceramics for application to orthopedics and dentistry. The findings indicate that they exhibit biological affinity with and activity relating to the surrounding host tissues when implanted.19-23) Moreover, synthetic ceramic materials (such as calcium phosphates) have been widely used in medicine and oral biology owing to the apatite-like structure of the enamel, dentin, and bones—usually called “hard tissues.” However, their exact composition, distribution of phases, and structure remain unclear, although several sophisticated characterization techniques are available to investigate tooth and bone tissues.24) Studies have found that synthetic CaP preparations help understand the physicochemical behaviors of biological mineral phases, as many hard tissues have exhibited similarity to them.25) To gain better insight into the complex structures of biological mineral phases, there is a need for a well-defined characterization of synthetic CaP, where its composition, crystallinity, and nanostructure are examined. These properties are crucial to the bioactivity of CaP-based materials in terms of enhanced contact area and degradation.26) Studies have shown that an apatite layer usually forms on the surface of the ceramic layer containing a carbonate ion. It is called “bone-like” apatite, and can form a bond with the human bone.27) Experiments have shown that bioceramics can be used as coating on implants to improve biocompatibility,28) or injected into bone using non-invasive surgical techniques. 29) The bioactivity of CaP materials is dependent on many factors during the synthesis procedure, such as precursor reagents, impurity contents, crystal size and morphology, concentration and order of mixture of reagents, pH, and temperature. Moreover, the bioactivity response of CaP materials is dependent on the thermal treatment profile for drying and sintering, which are in turn dependent on the parameters during synthesis. Consequently, a route is selected for each application.30)
In this study, we report the synthesis of nanostructured HA powders via a wet chemical technique along with the resulting powders. Subsequently, thermal and slurry stability as well as the electrical, mechanical, and biocompatibility-related properties of the powders are evaluated.
2. Experimental Procedure
2.1. Materials and Methods
Solutions of 0.09 M diammonium hydrogen phosphate [(NH4)2HPO4, %99, Merck; No.1207] and 0.15 M calcium nitrate 4-hydrate [Ca(NO3)2·4H2O, %98, Merck PROLABO; No.22 384.298] were prepared, and the pH of the both solutions was brought to approximately 11 through the addition of 1 M of a sodium hydroxide solution [NaOH, %99, Merck; No.5226926]. The phosphate solution was added dropwise into the calcium nitrate solution and, as a result, HA powder was obtained. The precipitation of HA can be described by the reactions in (1) and/or (2):31)
The precipitate was aged for 22 h at room temperature on a magnetic stirrer (750 rpm). The precipitated HA was then centrifuged and washed by de-ionized water. The powders were centrifuged and washed three times. The resulting powder was dried in a freeze-drier system (Alpha 1-2 LD, Germany) for 10 h. The dried powder was calcined in an electrical box furnace at 900°C for 1 h at a rate of 5°C/min in air.
2.2. Sample Characterization
2.2.1. Fourier-transform infrared spectroscopy (FTIR)
A Fourier-transform infrared spectroscopy with a Bomem MB 100 spectrometer was used to examine the powder sample. For IR analysis, 1 mg of the sample was carefully mixed with 300 mg of KBr (infrared grade) and pelletized under vacuum. The pellet was then analyzed in the range of 400 to 4000 cm−1 at a scan speed of 23 scans/min a resolution of 4 cm−1.
2.2.2. X-ray diffraction (XRD)
XRD (Siemens-Brucker D5000 diffractometer) was used to analyze the resulting powder. This instrument operated at voltage and current settings of 40 kV and 40 mA, respectively, and used Cu-Kα radiation (1.540600 Å). For qualitative analysis, XRD patterns were recorded in the interval 5° < 2θ < 70° at a scan speed of 2°/min, with 0.02° as the step size and a step time of 1 s.
2.2.3. Thermal analysis
The thermal behavior of HA was studied by thermal analysis. A thermoanalyzer (STA; Polymer Laboratories PL-STA 1640), which operated from room temperature to 1200°C at a heating rate of 10°C/min, was used to record the conventional thermoanalytical curves [DTA (differential thermal analysis) and TGA (thermal gravimetric analysis)].
2.2.4. Bulk elemental analysis
A Shimadzu UV-31005 instrument was used to calculate the Ca/P molar ratio of the precipitated powder. The contents of Ca and P were chemically analyzed by quantitative chemical analysis via EDTA titration and atomic absorption spectroscopy (AAS) (n = 5).
2.2.5. Scanning electron microscopy (SEM)
The powder sample was coated with a thin layer of gold (Au) through sputtering (EMITECH K450X, England). A scanning electron microscopy (SEM) system (Tescan Vega 2XMU) that operated at an acceleration voltage of 15 kV was used to determine the microstructure of the powder sample.
2.2.6. Transmission electron microscopy (TEM)
Transmission electron microscopy (TEM; CM200-FEG-Philips) was used to characterize the particles, which were deposited onto Cu grids that supported a carbon film formed by deposition from a dilute suspension in acetone or ethanol. By using diffraction (amplitude) contrast and high-resolution (phase contrast) imaging for crystalline materials, the shapes and sizes of the particles were determined.
2.2.7. Sinterability and determination of lattice parameters
Using a pressure of 80 MPa, 0.2 g of each kind of milled powder was uniaxially pressed into disks. At a heating rate of 5°C/min, all disks were sintered at three temperatures—1200, 1300, and 1400°C—and soaked at each temperature for 1 h before cooling through a furnace (n = 5). Consequently, the XRD patterns of the disks were acquired to determine their sinterability values. The lattice parameters a and c of all powders at different temperatures were calculated by using Equations (3) and (4), respectively:
where d is the spacing between planes in the atomic lattice. The volume V of the hexagonal unit cell was determined for each HA formulation from Equation (5):
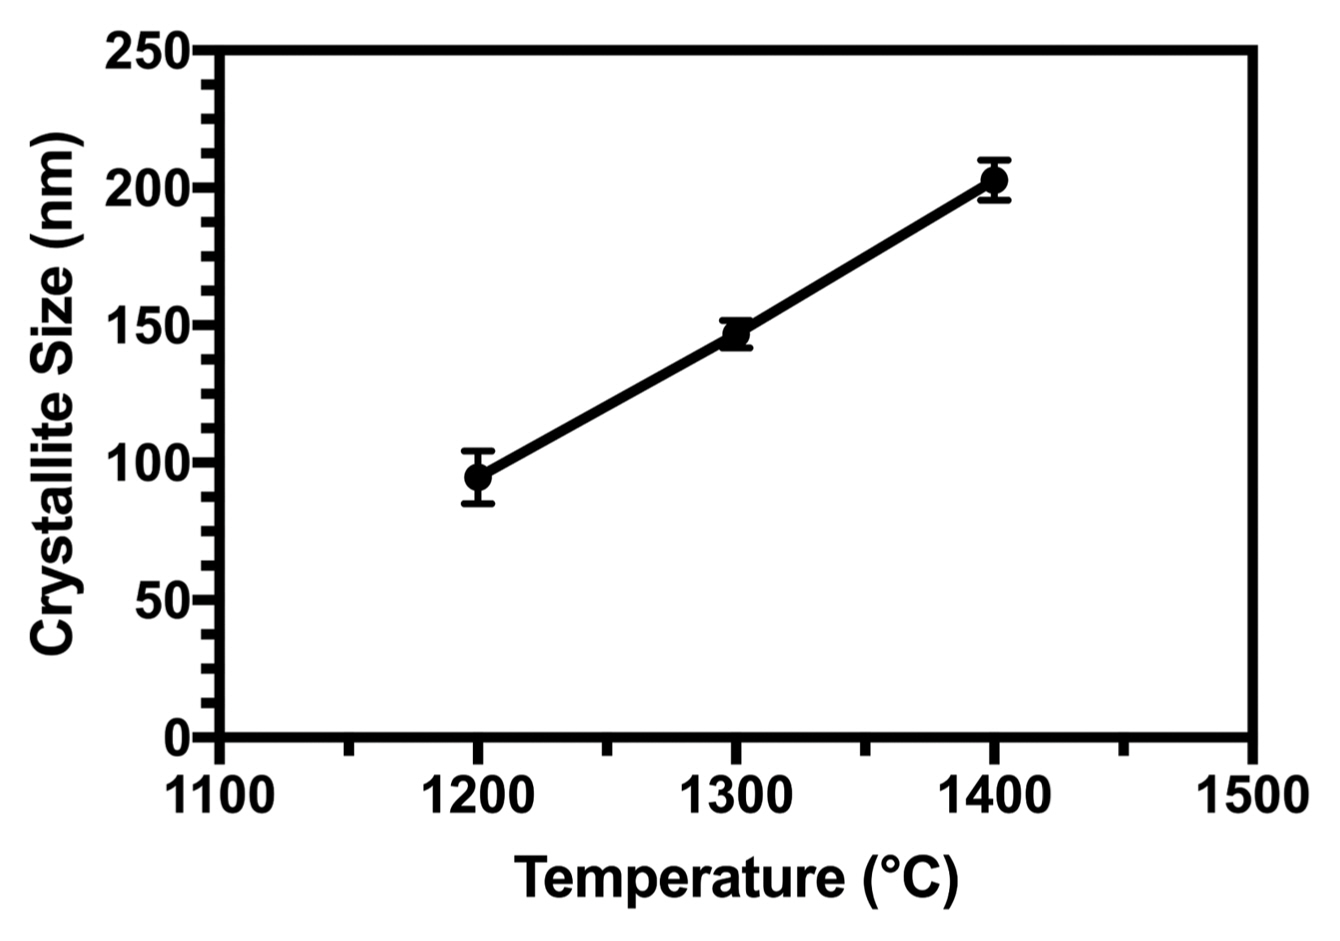
The crystallographic identification of the phases of the synthesized apatite was accomplished by comparing the experimental XRD patterns with standards compiled by the International Center for Diffraction Data (ICDD), card #09-0432 for HA. The Scherrer approximation (6) was used to calculate the average size of HA crystallites using the XRD data:
where D(hkl) is the size of the crystallite, as calculated for the (h k l) reflection, λ is the wavelength of Cu-Kα radiation (1.5406 Å), β1/2 is full-width-at-half-maximum intensity, and k is the broadening constant with crystal habit, chosen as 0.9 for elongated apatite crystallites.
2.2.8. Electrical properties
Using the impedance method on a HP4192A impedance meter between 200°C and 800°C with the signal frequency ranging from 5 Hz to 13 MHz, electrical conductivity measurements of hydroxyapatite samples were performed. (n = 5). The sample powders were pressed at 50 kN/cm2 and their compactness was determined to be approximately 80%. Electrodes were prepared with silver paint on both sides of the pellets.
2.2.9. Mechanical properties
2.2.9.1. Hardness, elastic modulus, and fracture toughness
The indentation of the digital microhardness tester (Model MXT70, Matsuzawa Seiki Co., Ltd, Tokyo, Japan) helped determine the mechanical properties of the disks (n = 5). Using a Vickers and Knoop indenter, the 10 mm-diameter disks were subjected to a load of 200 g for 15 s. A total of five indentations were made, and the resulting hardness values were averaged to determine the standard deviation of the hardness of each sintered and polished disk. Following the experiment, the results led to a mean with a variation of two standard deviations. Hardness was calculated using the procedure for ASTM E-384 using Equation (7):
In this equation, HV represents the Vickers’ hardness number (kg/mm2), P is the applied load (N), and d is the diagonal of indentation (m). For the Vickers’ indent, both diagonals on each indentation were measured manually and averaged. The elastic modulus was calculated according to the procedure described by Marshall et al.12) using Equation (8):
where a is the length of the shorter diagonal, b is the length of the longer diagonal, and b′ is the crack length. Variables a and b are in correspondence with the Knoop indenter. Fracture toughness was calculated using Equation (9):
where E is Young’s modulus (GPa), c is crack length (m), and a is the mean length of the diagonal as observed in Vickers’ indentation.
2.2.9.2. Sintering density
The densities of the sintered disks were calculated using the formula density = weight/volume. Once the three samples had been weighed, their densities were separately calculated to determine the average.
2.2.9.3. Flexural strength
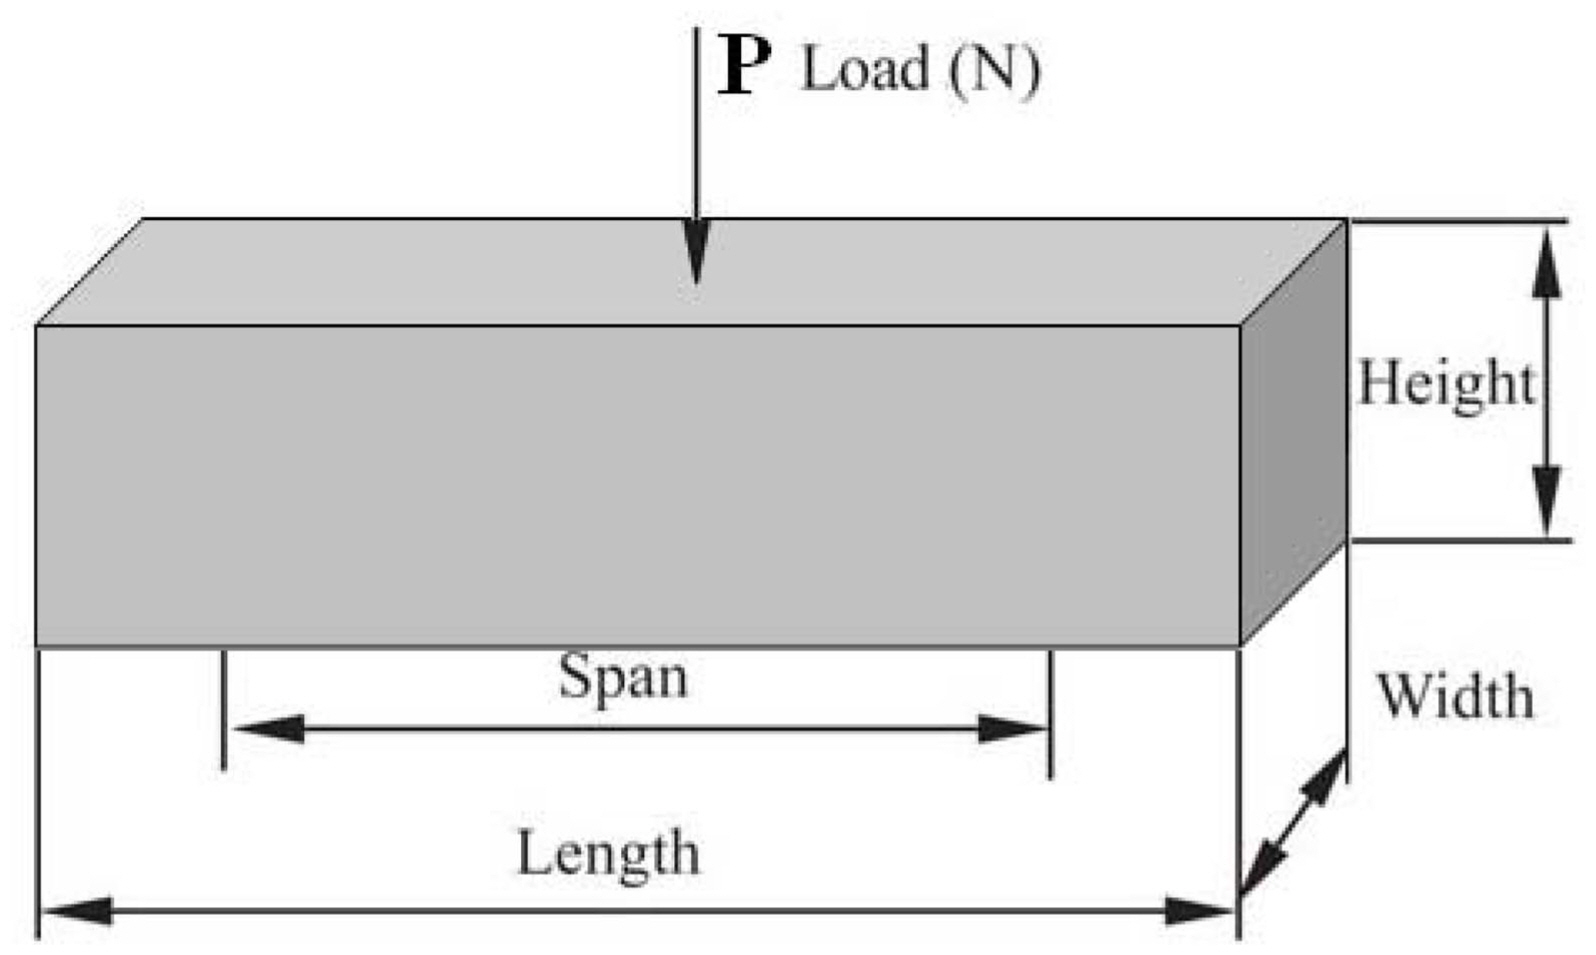
A universal testing machine (Instron 1196) at room temperature was used to determine the three-point flexural strengths of the heated samples at different temperatures (n = 5). The loading rate was 0.5 mm/min and the flexural strength, σ, was calculated by Equation (10):
where L, b, and h are the span, thickness, and height of the specimens, respectively. Pmax was the maximum flexural load during the test. A schematic diagram of the specimen used for the flexural strength test is shown in Fig. 1.
2.2.10. Sedimentation analysis
Suspensions of 5 vol.% HA in the absence and presence of dispersant were used for sedimentation measurements. After mixing for 24 h, part of the suspensions was poured into graded tubes and the volume of sedimentation was recorded (n = 5).
2.2.11. Biological properties
2.2.11.1. Solubility
All dissolution tests were conducted in triplicate in SBF (n = 5). The SBF solution was prepared by dissolving reagent-grade NaCl, KCl, NaHCO3, MgCl2·6H2O, CaCl2, and KH2− PO4 into distilled water and buffered at pH=7.25 with TRIS (trishydroxymethyl aminomethane) and HCl 1 N at 37°C.32)
Samples of sintered HA were ground into a fine powder while being ultrasonically washed in acetone and rinsed with deionized water. A total of 10 mg of each granule was soaked into 30 mL of the solution at 37°C for durations varying from 1 to 14 days. The samples were centrifuged after immersion periods of 1, 3, 5, 7, 9, and 14 days. EDTA analysis was used to measure changes to the concentrations of calcium in the supernatant. It is worth noting that the Ca concentration in the supernatant of each sample was reported as the amount of solubility.
2.2.11.2. Biocompatibility
An adult rabbit back shank was used to extract osteo-blast-like cells (the cells used in the culture test were cells (osteoblast progenitor cells) derived from the bone marrow of an adult rabbit). The cells were washed twice in a phosphate buffer solution (PBS) and collected via centrifugation. Under standard incubation conditions (5% CO2, 37°C), the cells were incubated for approximately one week in different cultural media containing Dulbecco’s Modified Eagle’s Medium (DMEM), dexamethasone, vitamin C, and β-sodium glycerol-phosphate.
For 20 min, the samples were sterilized in 120°C water/steam. They were then placed in 24-well plates for osteoblast-like cell implantation at a set density of 4.8 × 10⁴ cells mL−1 (n = 6). In standard culture conditions, the osteoblast-like cells were further incubated in a DMEM solution supplemented with 10% FBS for one to seven days. In characterizing cell attachment, the samples were taken out every day for digestion with a 0.25% trypsin EDTA solution, and the number of cells was evaluated by a haemacytometer.
2.2.11.3. Cytotoxicity
Cytotoxicity was tested using the L929 mouse fibroblast cell line (ATCC). The cells were seeded in polystyrene plates enriched with the Minimal Essential Medium, supplemented by 10% fetal bovine serum, 100 units/mL of penicillin, and 100 μg/mL streptomycin, and were incubated at 37°C in humid atmosphere and 5% CO2. Once the cells had attained confluence, the sterilized disks were placed in direct contact with them and incubated for 48 h under the same conditions using negative (ultra-high molecular-weight poly ethylene) and positive (copper) controls. After 48 h, the cells were observed under an optical microscope to check for cytotoxicity (Nicon E200).
3. Results and Discussion
3.1. FTIR Analysis
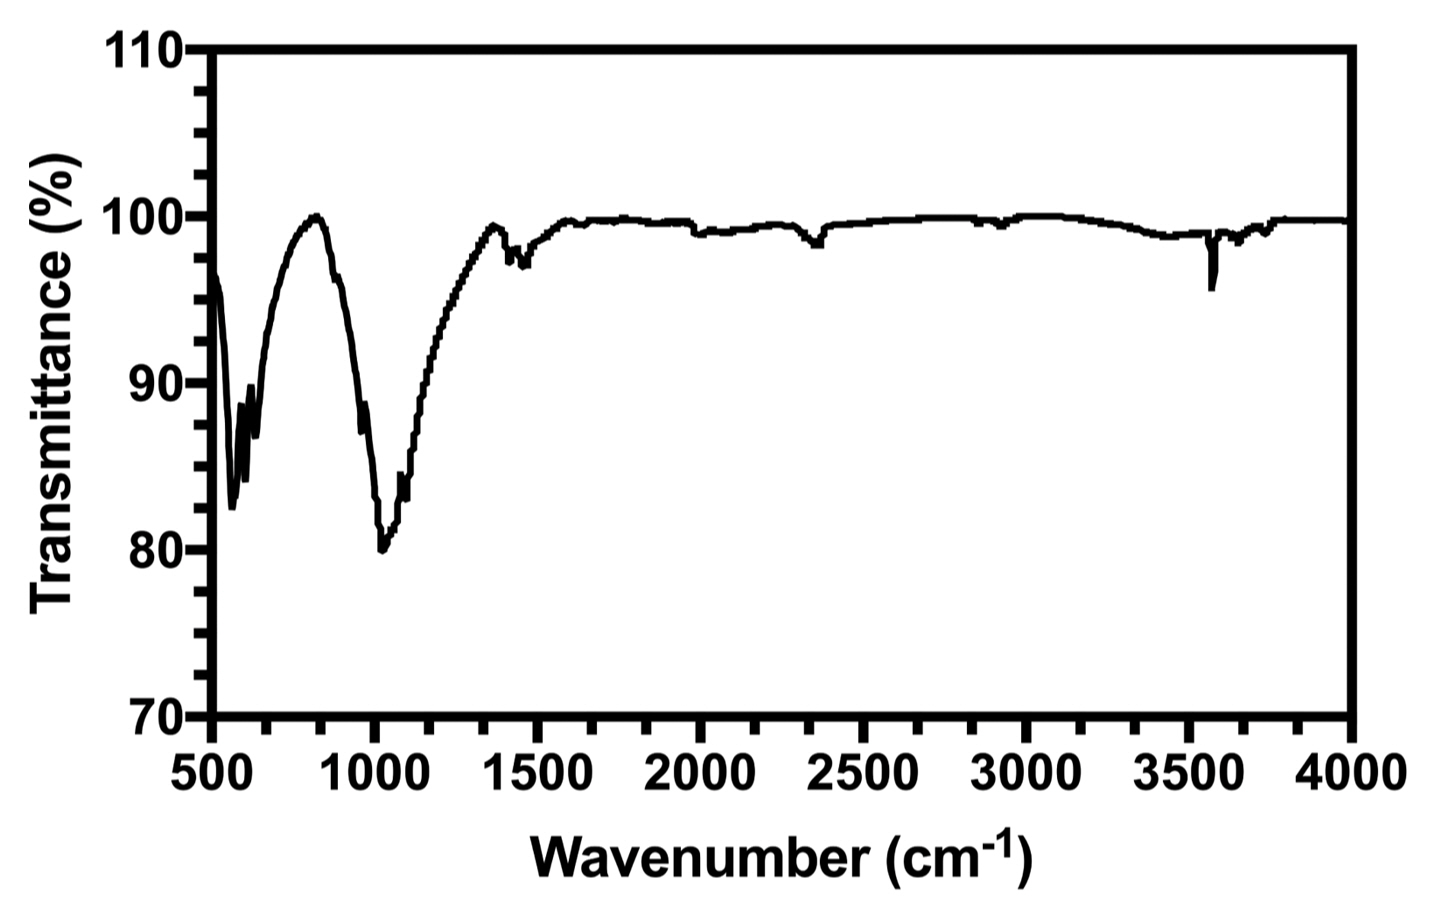
Figure 2 shows the FTIR spectrum of the HA powders.
The characteristic bands (listed in Table 1) in the sample spectrum were assigned as follows: (a) two bands recorded at 3581 cm−1 and 632 cm−1 owing to the stretching and liberational modes of hydrogen-bonded OH− ions, respectively. (b) The band at 1026 cm−1 was due to ν3 PO4, and the bands at 604 cm−1 and 563 cm−1 were due to ν4 PO4.
FTIR analysis showed all typical absorption characteristics of HA. Some carbonate content was also observed (CO3−2 peak around 1646 cm−1), as was carbonate apatite. Carbonate apatite is hypothesized to have originated from the absorption of carbon dioxide from the atmosphere.33) It can be concluded that the synthesized powder was HA.
3.2. Thermal Analysis
The DTA and TGA (STA: simultaneous thermal analysis) curves of the HA powder are shown in Fig. 3. The first endothermic region ranged from 90 to 300°C with a peak at approximately 250°C that corresponded to the dehydration of the precipitating complex. The weight loss of the physically adsorbed water molecules of the HA powder was calculated to be approximately 17%. With increasing temperature from 300 to 1200°C, no peak was recorded except when a weight loss of 7% was observed at the TGA curve in the temperature range. It can be concluded that this was a result of the gradual dehydroxylation of the HA powder, which can be explained by the following reaction (11):34)
3.3. Elemental Analysis
The measured elemental composition (Ca and P content) and Ca/P molar ratio are summarized in Table 2.
Experimental data show that the bulk of the Ca/P molar ratio was 1.71. The measured Ca/P ratio for this synthesized powder was higher than the stoichiometric ratio (1.667). The expected value of a pure HA phase can be obtained in two ways: (a) The Ca/P molar ratio can be as high as 3.33 with the local presence of carbonate apatite,35) or (b) the presence of impurities such as CaO.
3.4. SEM/TEM Observations
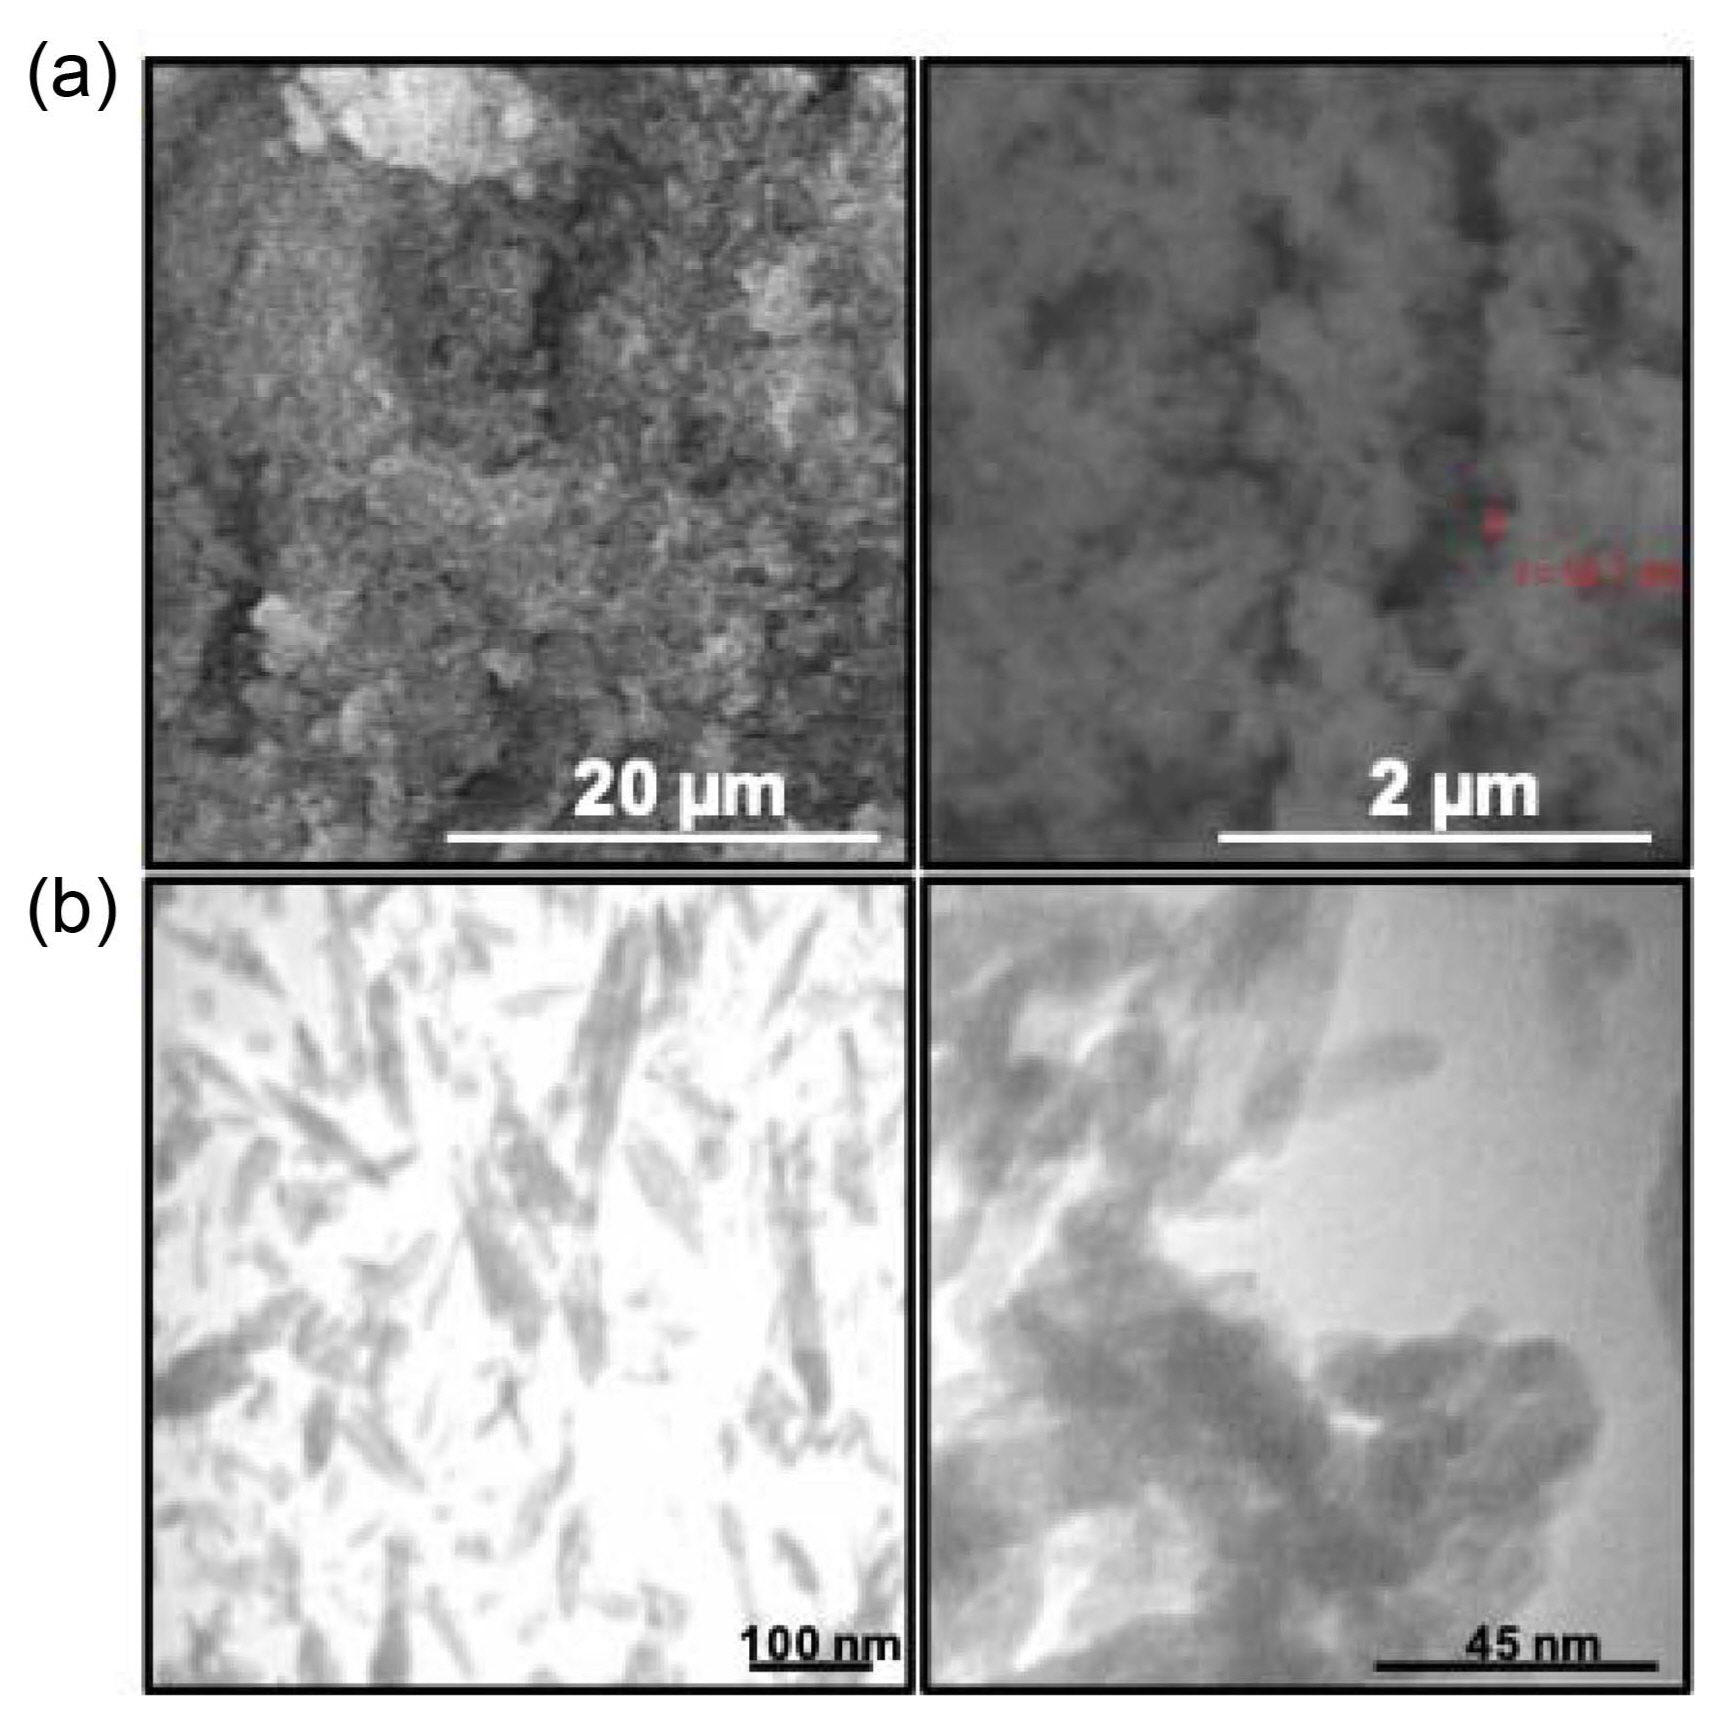
SEM was used to examine the microstructure of the synthesized powders. The SEM micrographs of the synthesized powders are shown in Fig. 4(a). The powder particles show a needle-like morphology with a distribution of small particles. Moreover, there are large agglomerates consisting of fine particles that are cold-welded together. As shown in this figure, the sizes of some particles have been determined.
TEM was used to examine and estimate the sizes of the synthesized powder crystallites. TEM micrographs of the powders in different magnifications are shown in Fig. 4(b). The microstructure of the HA crystallite is almost needle-like with a mean crystallite diameter of 15 ± 5 nm and length of approximately 45 ± 10 nm. As shown in Fig. 4(b), nanoparticles indicated by arrowheads contained some fine holes in their structure, which may be related to their synthesis. As the synthesis of HA was carried out in an alkaline environment (pH was approximately 11), there were some highly corrosive hydroxyl groups in the synthesis reactor that caused defects in the structure.
3.5. Sinterability
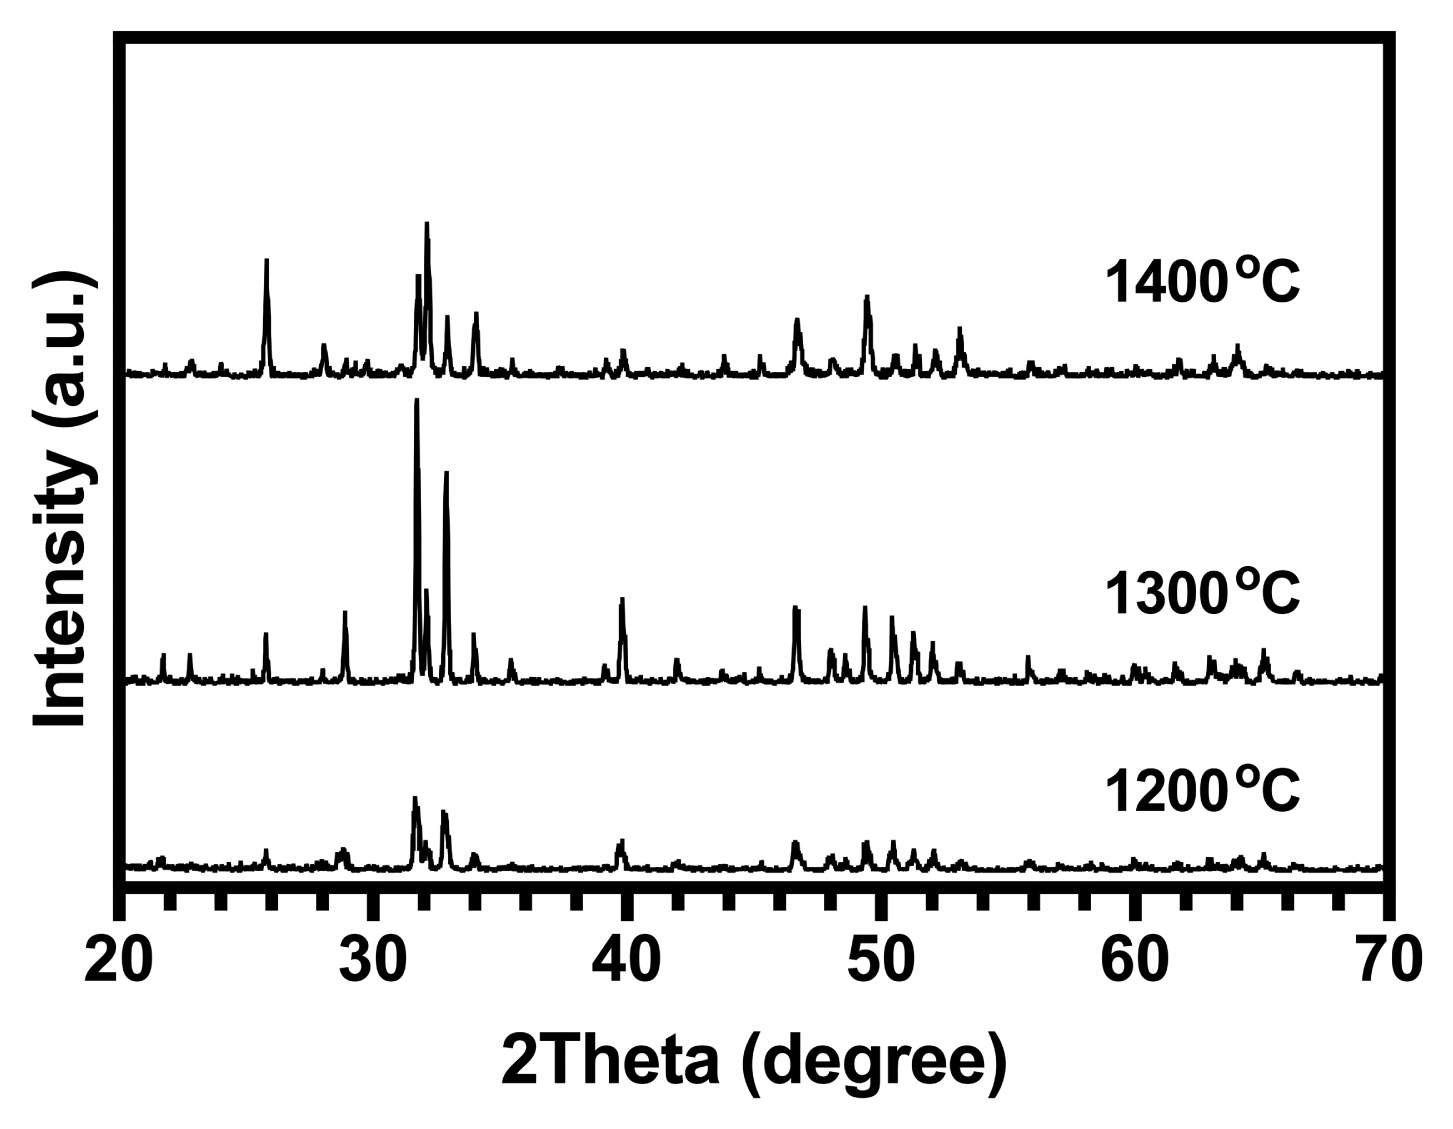
XRD was used to determine the phase distribution of the sintered samples of HA at different temperatures. The XRD patterns are presented in Fig. 5. For pure HA, only apatite peaks were observed after sintering at 1200°C. The lack of β-tricalcium phosphate (β-TCP) at 1200°C suggests that the synthesized HA was approximately stoichiometric, indicating that it might have HA-decomposed to β-TCP at 850°C (for stoichiometric compounds).36) The partial decomposition of HA to β-TCP occurred when the sintering temperature was increased to 1300°C in pure samples due to the sintering process. As the β-TCP phase was a low-temperature TCP phase, it needed to be derived from the high-temperature alpha-tricalcium phosphate (α-TCP) phase through the phase transformation from α-TCP to β-TCP (this means that during cooling, α-TCP was converted to β-TCP and thus, the peaks related to α-TCP were not observed in XRD patterns).37) According to the reaction in Equation (12), when the temperature was 1400°C, both HA and tetracalcium phosphate (TTCP; Ca4P2O9) were observed:38)
At a temperature of 1350°C, the HA was directly converted into α-TCP and TTCP. Therefore, at 1400°C, TTCP was significantly higher than α-TCP. Consequently, at this temperature, only the TTCP phase was detected whereas the α-TCP phase was not.
The peak intensity related to the (0 2 10) lattice plane of tricalcium phosphate (TCP), the (0 4 0) lattice plane of tetracalcium phosphate (TTCP), and the (2 1 1) lattice plane of the apatites in the XRD patterns of the HA samples were used as direct indicators to determine the relative amounts of TCP and TTCP obtained at different temperatures. The calculated amounts of TCP and TTCP are given in Table 3.
Densification during sintering was controlled by mass transfer through evaporation-condensation, surface diffusion, volume diffusion, and grain boundary diffusion.39)
3.5.1. Determination of lattice parameters (a and c)
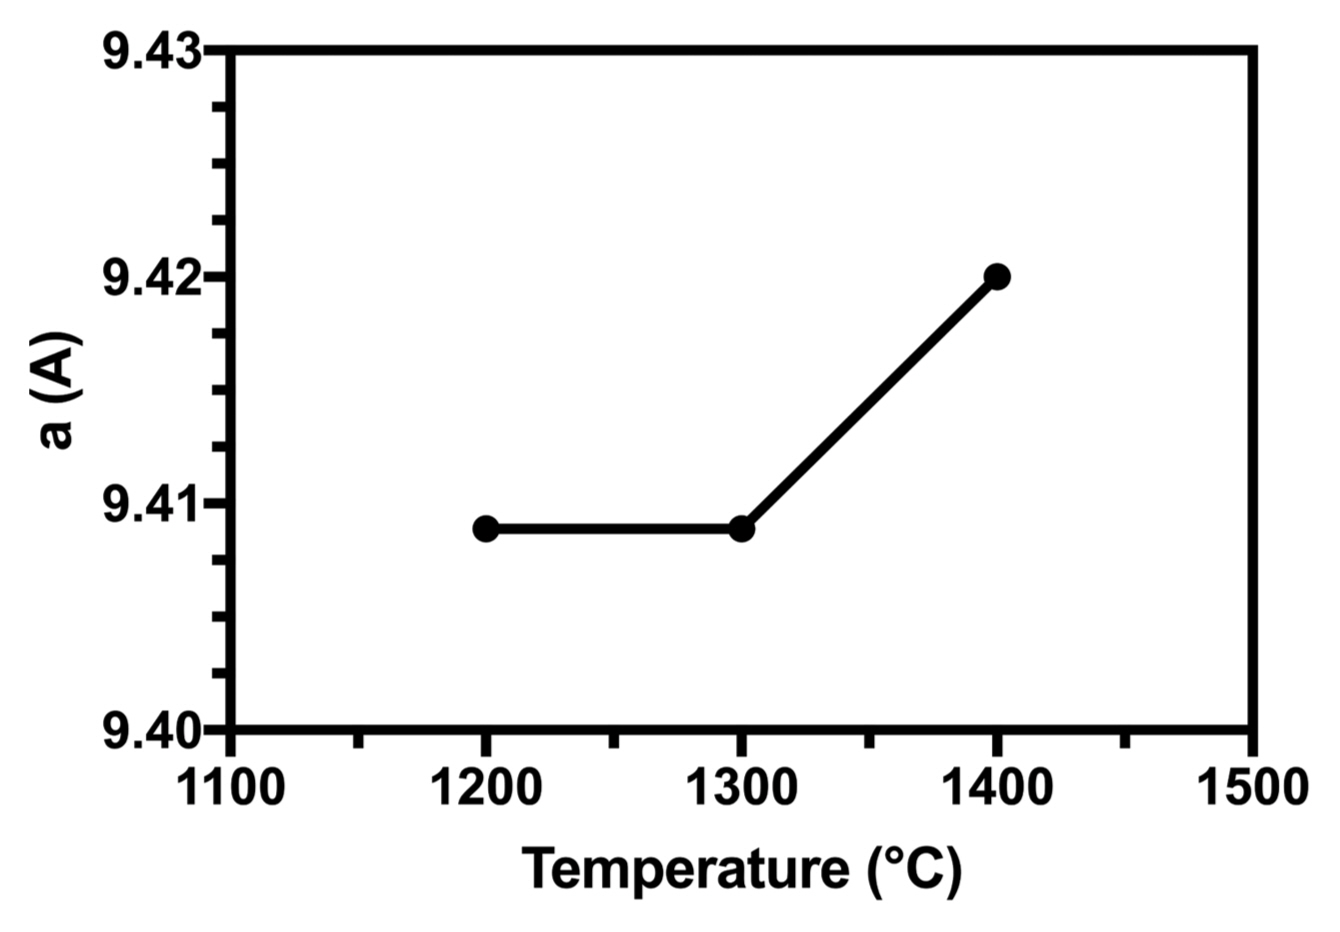
The calculated lattice parameters and cell volumes for all samples are given in Table 4. The lattice constants of pure HA generally corresponded to the data reported in Ref.:40) a = 9.432 Å and c = 6.882 Å, with the a value being slightly similar.
The dependence of the lattice parameters on the heat-treatment temperature for the powder sample is shown in Fig. 6. When the heat-treatment temperature was above 1200°C, the lattice constant a showed a trend of increase, possibly due to the destabilization of the apatite lattice near the phase transformation of HA to the TCP temperature. Results reported by Gross et al. have shown the non-linear dependence of a on sintering temperature.41) The reduction in the lattice parameter is indicative of a denser structure produced at higher sintering temperatures. Our results indicate this at 1200°C.42) Lattice shrinkage can be attributed to (i) the ordering of and increase in the crystallinity index of the structure, (ii) effect of dehydroxylation,43) and (iii) formation of oxyapatites of smaller lattice parameters after heating than HA.44)
3.6. Electrical Properties
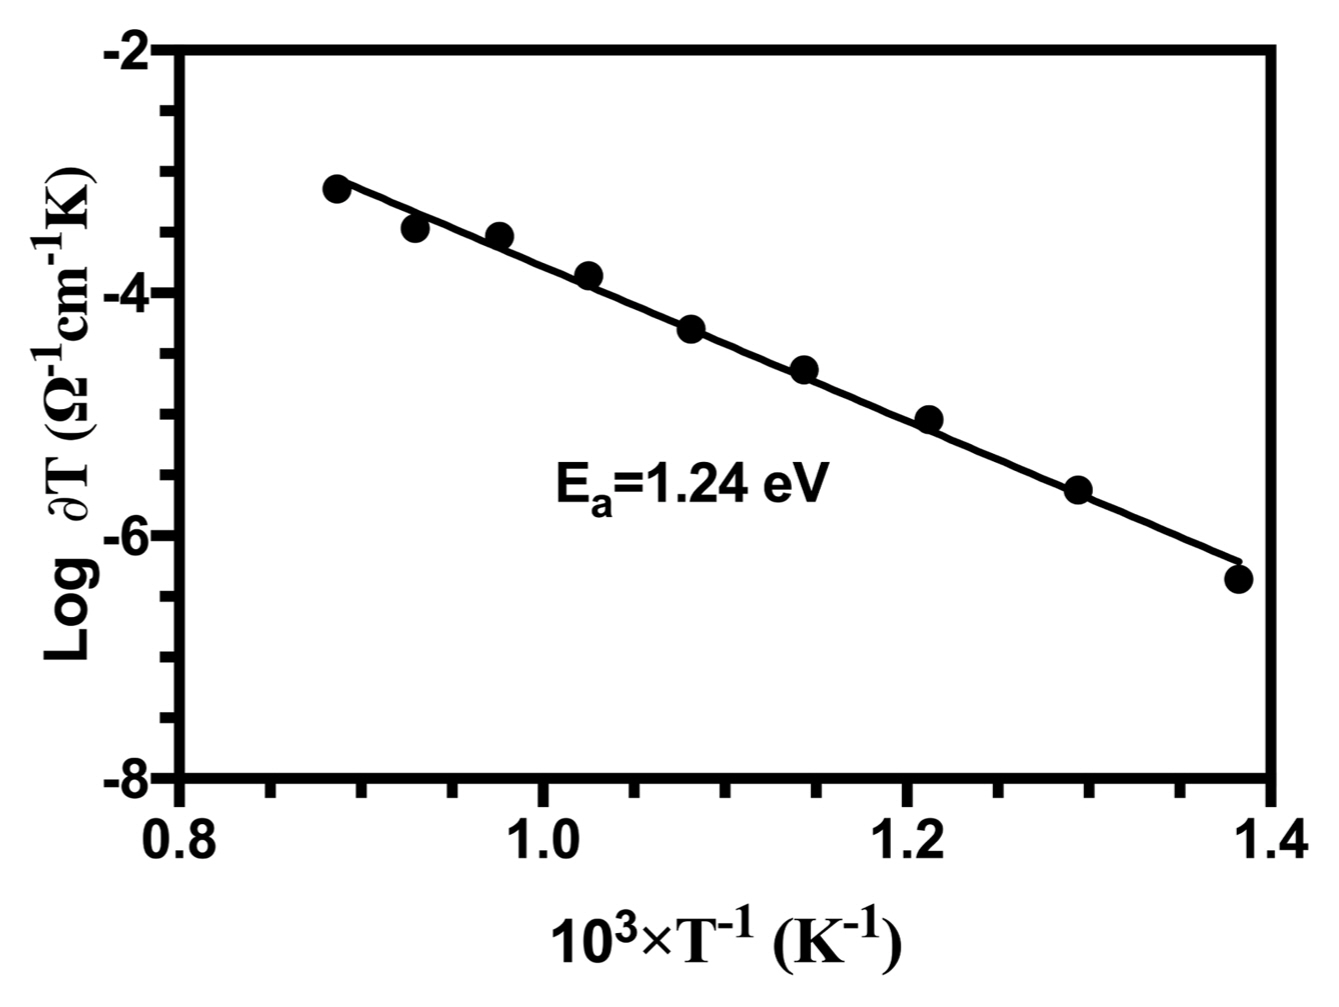
Figure 8 shows Arrhenius plots of the ionic conductivity of the HA samples.
Two distinct proton conduction mechanisms can be formulated in HA conductors: (i) proton conduction between two neighboring OH− … OH− ions (OH− + OH− → O−2 + HOH), and (ii) a proton jump from the first OH− ion to the next via PO4−3 ions. The proposed mechanism is:
where (□OH−) indicates a vacancy at an OH− lattice site, and O−2 is an oxide ion converted from an OH− ion. Dental caries occurs by the protonation of PO4−3 ions in the tooth is during the last mechanism. Thus, proton transport along an OH− chain in an apatite is the elementary step in acid attack, which initiates demineralization and leads to lesions.45) Structural results have shown that the distance between adjacent OH− ions is 3.44 Ǻ, which is too large for protons to hop.28) However, the distance between an OH− and its adjacent PO4−3 is 3.07 Ǻ, short enough to form a hydrogen bond between the hydrogen-containing OH− ions and the double-bonded oxygen of PO4−3 ions. The second mechanism in stoichiometric apatites helps describe this mechanism.
According to the reaction, after the dehydration of HA when temperatures are high, proton hopping can occur along the c-axis between electroactive O−2 anions converted from OH− ions (Equation 13) as mentioned above.
3.7. Mechanical Properties
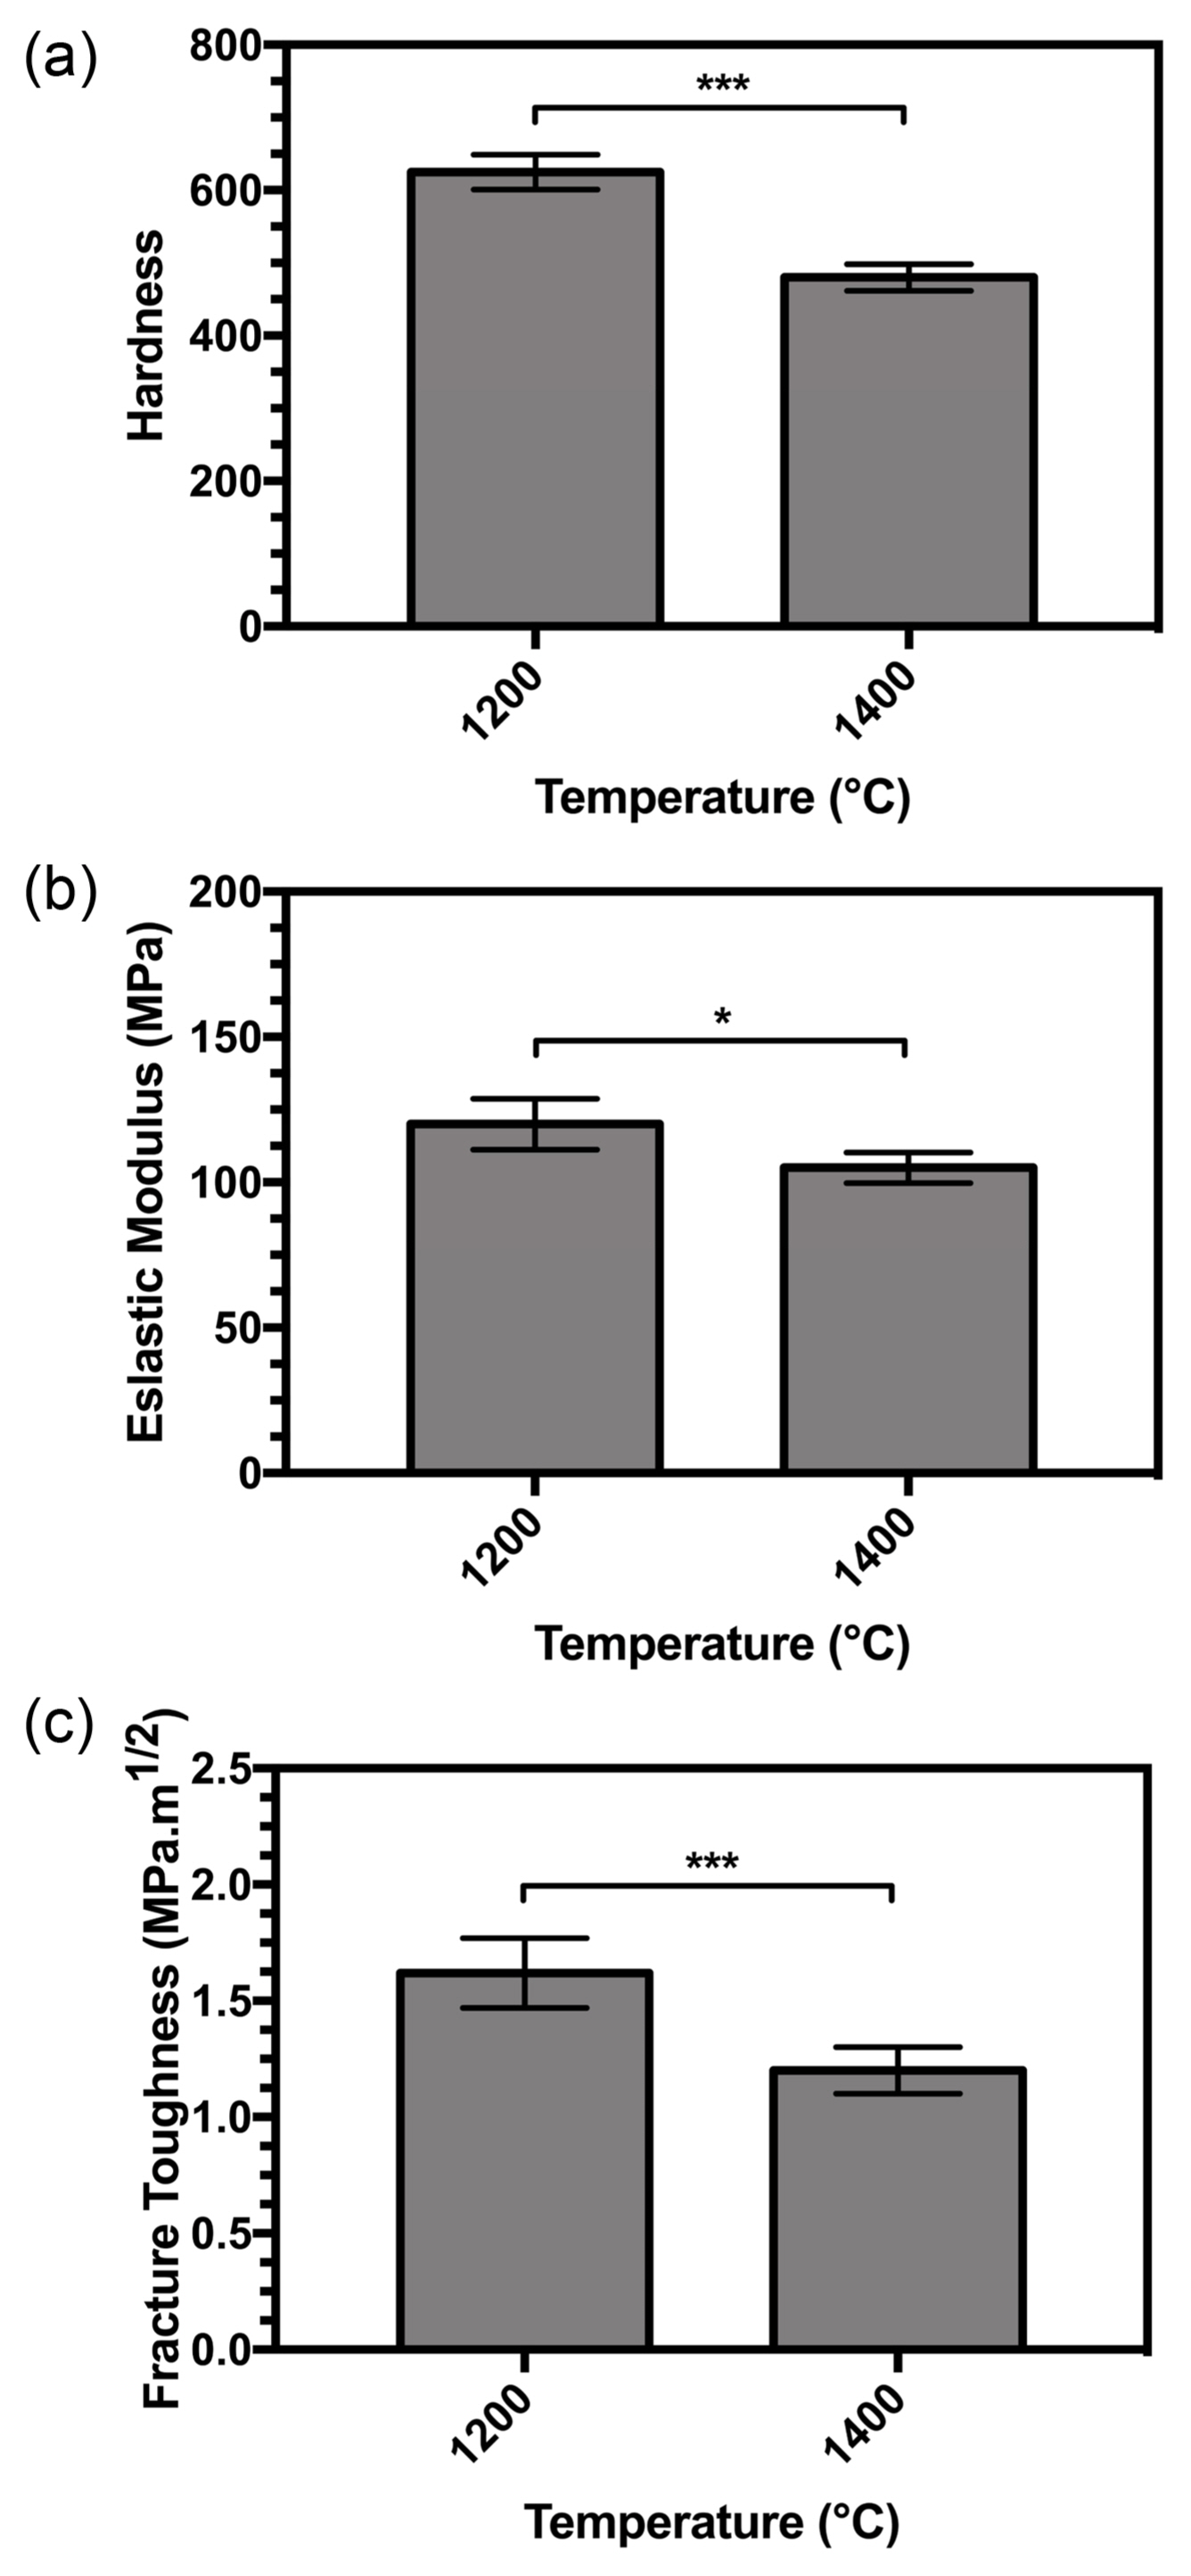
A reduction in hardness occurred at higher sintering temperatures, as shown in Fig. 9(a). The trend in the elastic modulus and fracture toughness showed a reduction with increasing temperature according to Figs. 9(b) and 9(c).
The small range of grain size in the sintered compact samples suggests that it had little influence on hardness. A range has been observed in the sensitivity of hardness to grain size in conventional ceramics,46) with reports on alumina having shown a clear decrease in hardness with larger grain size.47) Hardness data on sintered apatites in a report by Hoepfner et al. showed no variation in hardness at grain sizes larger than 1.5 mm with different densities.48) Hardness tests on strontium-incorporated apatites by Kobune et al. have shown little variation in hardness over a range of grain sizes (1.6-1.9 mm).49) The hardness and grain size data provided by Muralithran et al.50) indicate a decline in hardness with grain size, but independent work by Thangamani et al.51) has shown a smaller deviation.
Gross et al. have shown a hardness decreases at low compact density.52) According to Equation (12), with an increase in temperature, more H2O is released from the matrix in vapor form, leaving pores behind in the matrix because of the degree of decomposition. The density of the samples thus decreases at higher temperatures, and the hardness increases.
Fracture toughness is the only property discussed so far that is sensitive to both the pore content of the sintered body and the chemical composition of the sintered apatite. The combined effect of changes in composition and porosity result in a large change. As mentioned above, with increase in temperature, severe decomposition of the samples occurs (implying that large pores are created), and thus, the fracture toughness decreases with increase in temperature.
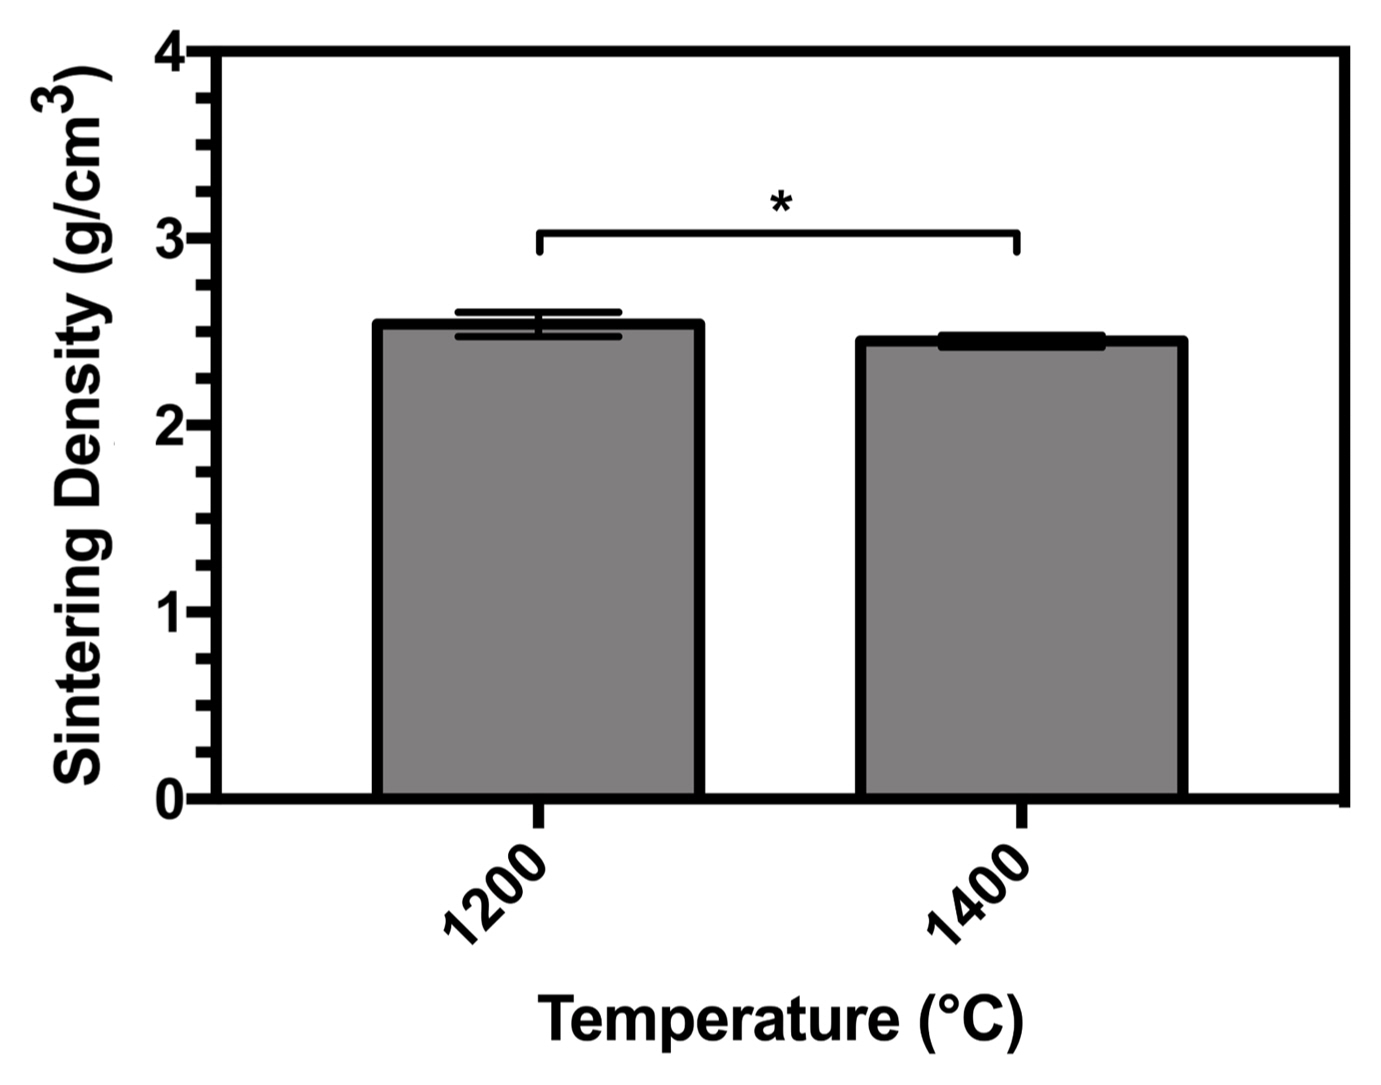
Figure 10 shows the sintering density of the HA sample sintered at two temperatures (1200°C and 1400°C). The results show that the density of the samples decreased at 1400°C. Notably, with increasing temperature, the thermal stability of HA decreased. Although the sintering temperature employed was as high as 1400°C, the density achieved was only in the range of 81.5%-86.5% of the theoretical density of HA. Sintering is the result of atomic motion induced by high-temperature heat treatment. Materials migrate from the grain boundaries between particles to the neck area, while the vacancies travel in the opposite direction to the materials and are discharged on the surface of the material. As a result, during sintering, the density of the material increases.53) Moreover, atomic motion and decomposition of the samples occurred at high temperatures in this study. The decomposition of HA can be expressed by Equation (12).
Once the apatite reached its decomposition temperature, H2O was released from the matrix in the form of H2O vapor, as shown in Equation (12), leaving pores behind in the matrix. As result, when the number of pores increased, the sintering density of HA decreased. Furthermore, at a temperature of 1400°C, the HA sample decomposed to TCP and TTCP, where the phase density was lower than that of the samples. Therefore, the above interpretation provides another reason for the reduction in HA density.
There is thus a close correlation between the sintering density of ceramics and their mechanical properties.
As shown in Fig. 11, with an increase in temperature from 1200 to 1400°C, the flexural strength of the samples decreased, which was especially severe because the number and sizes of pores of HA samples were high. SEM micrographs were used to obtain these results.
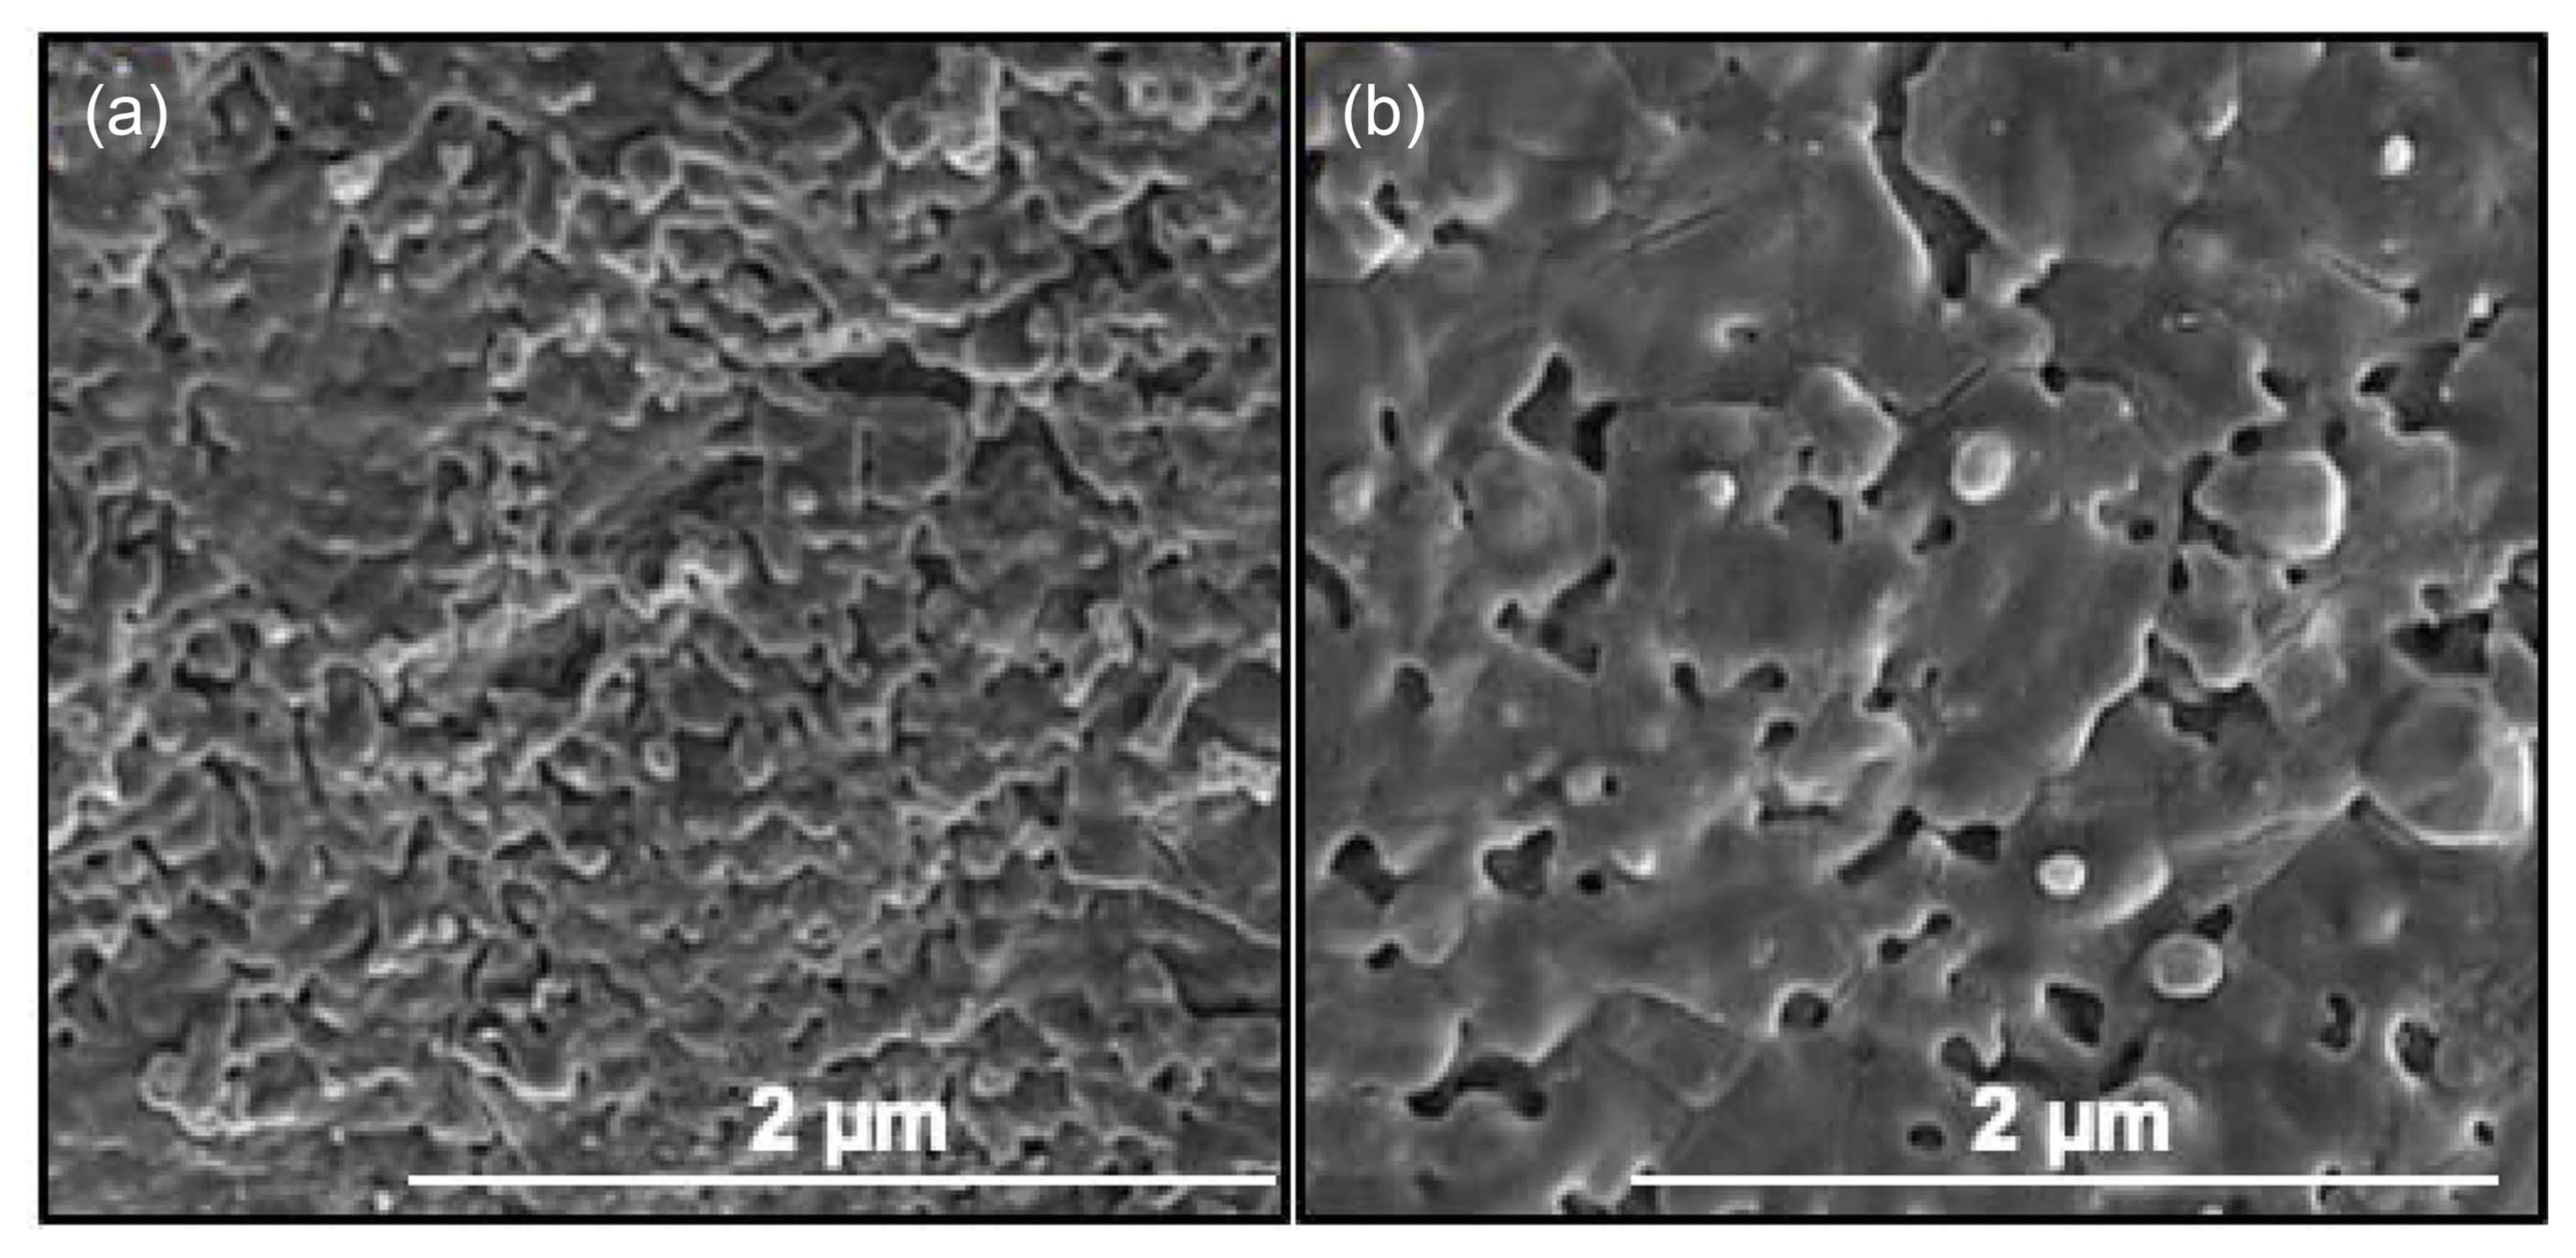
3.8. Microstructure Analysis
Figure 12 shows representative SEM images of the sintered samples at 1200 and 1400°C. At 1200°C, a number of irregular pores are observed on the surface of the sample. When the temperature increased to 1400°C, number and size of the pores markedly increases owing to the severe decomposition of HA to other phases (such as TTCP and β-TCP). These results were obtained from the sintering densities of the samples.
3.9. Slurry Stability
As shown in Fig. 13, the slurry is stable in the pH range of 10-12, at which the HA powder was stabilized electrostatically owing to high surface charge. In the low-pH region (pH ≤ 5), due to the dissolution of HA, the slurries were unstable. In the range of pH of 5-10, instability occurred owing to the low surface charge of HA particles (near the isoelectric point).
3.10. Biological Properties
3.10.1. Solubility
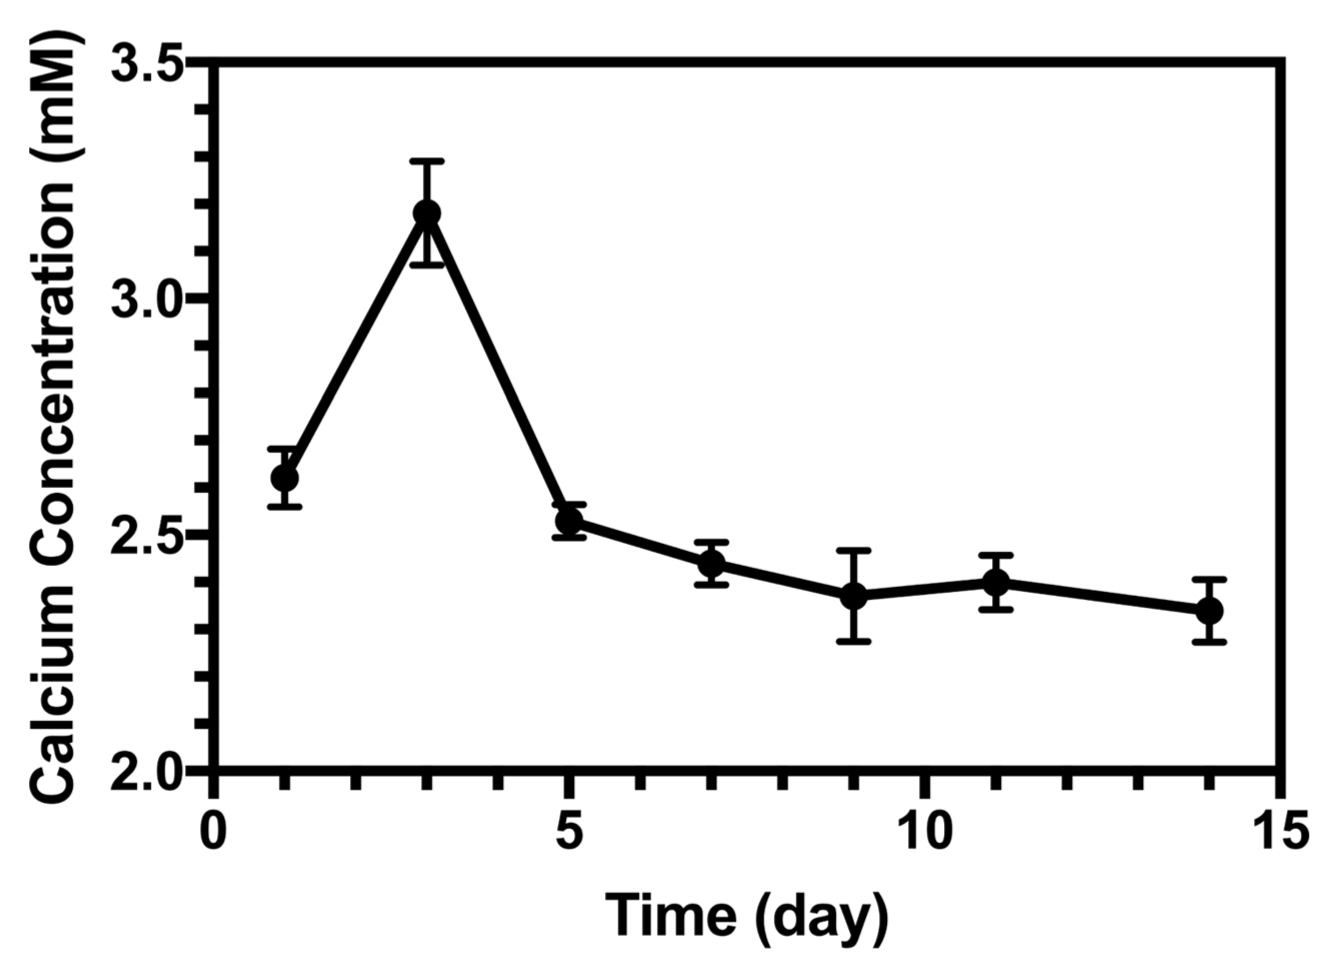
The Ca concentration changed in the SBF solution as a function of time, as shown in Fig. 14. On the first day, the dissolution was dominant. However, after three days, owing to the high concentration of Ca ions, the precipitation process became dominant and a decrease in calcium concentration occurred. Within 14 days of soaking, the calcium concentration reached its minimum. Experimental data for these results are available in the literature.54,55)
3.10.2. Cytotoxicity
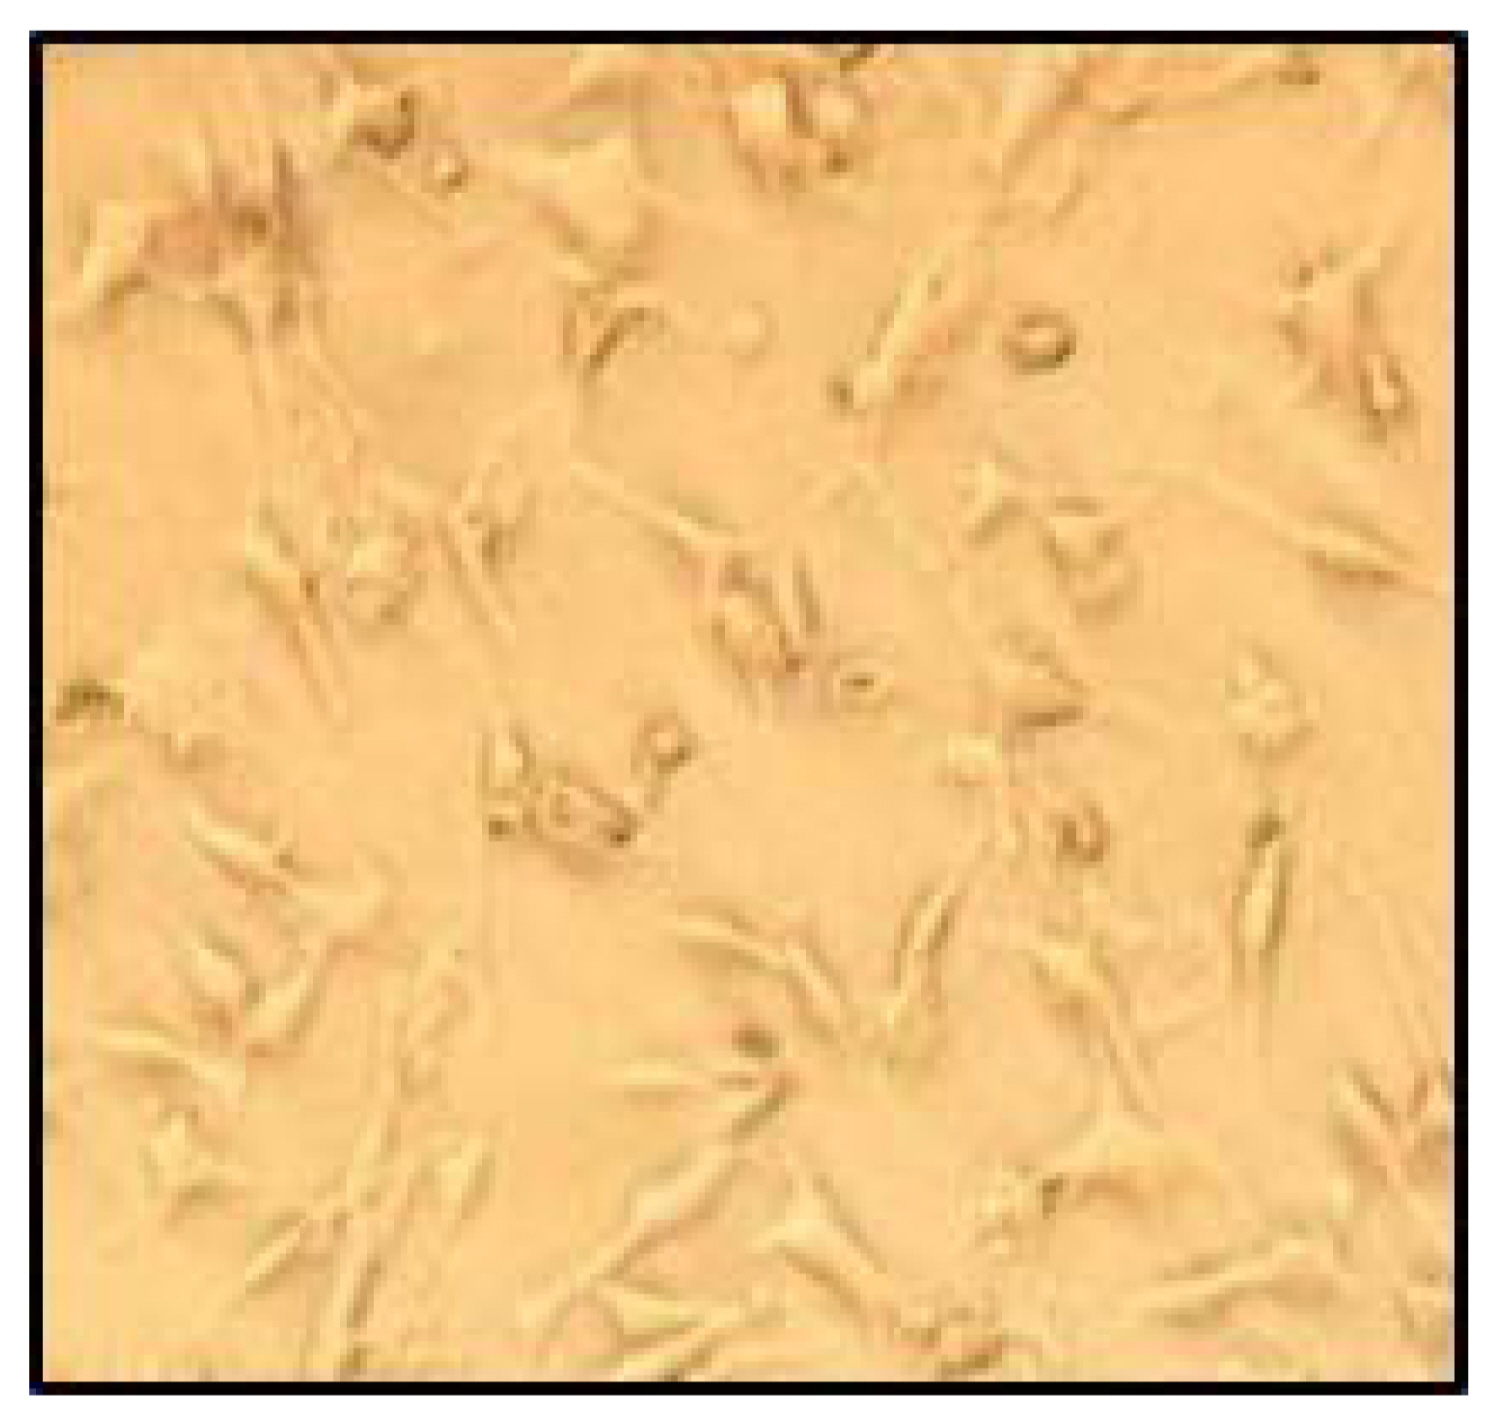
The L929 fibroblast cells displayed good adhesion and well-spread morphology on the sample (Fig. 15). Moreover, a layer formed when the cells were spindle-shaped.
3.10.3. Biocompatibility
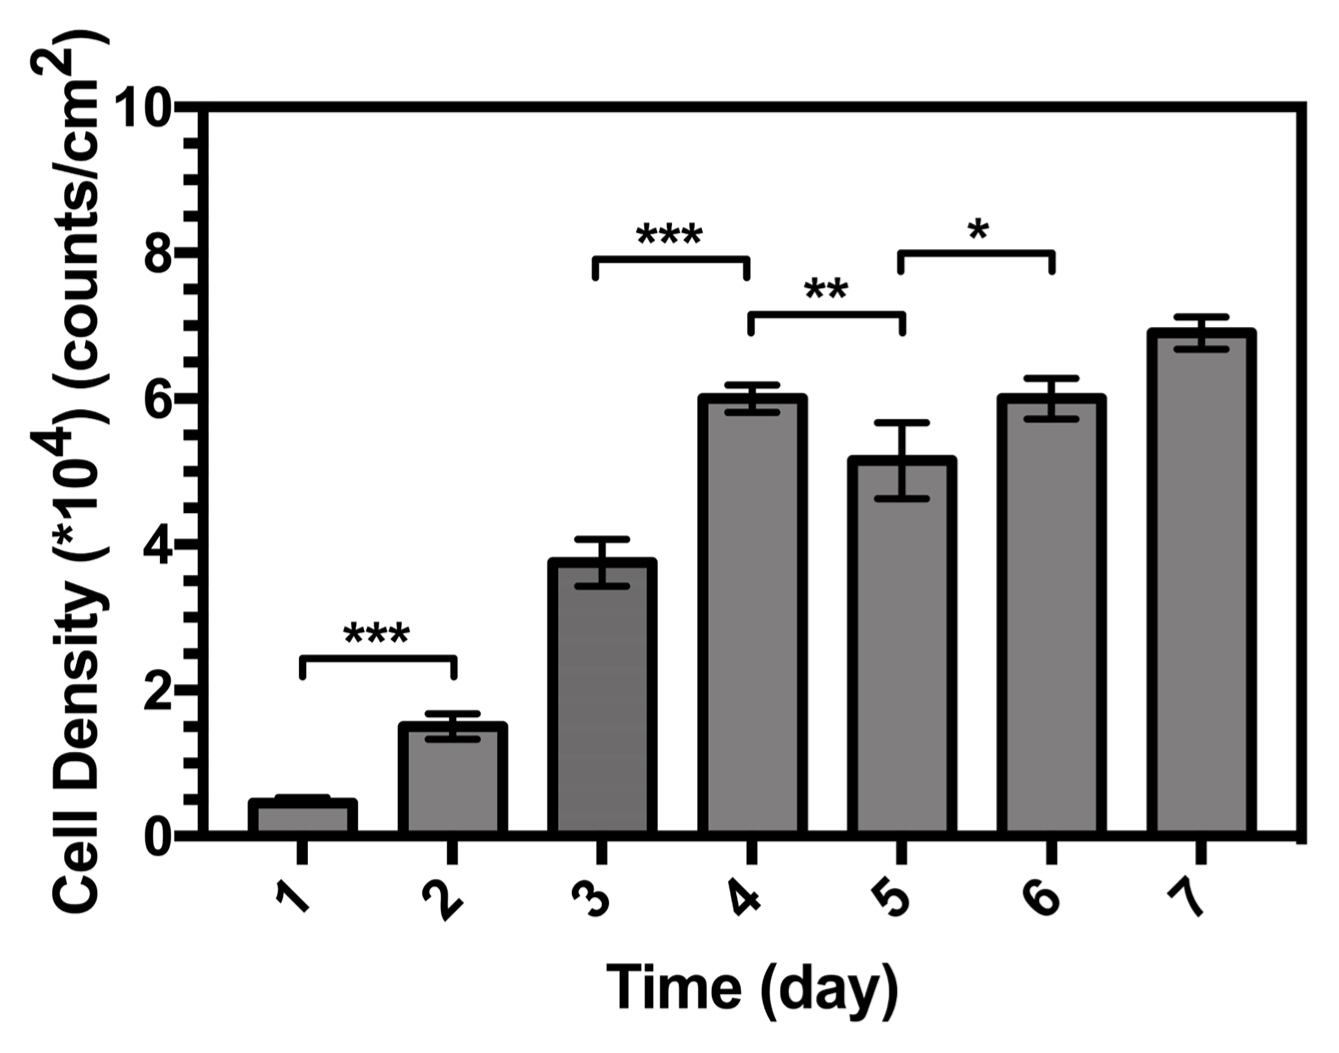
Quantifying the number of cells at each culture period helps directly monitor cell proliferation, and the results are shown in Fig. 16. Within the first two days, the number of cells increased slightly and a greater proliferation rate was obtained between two and five days; this trend then slowed until the seventh day.
Compared with the initial cell density, a significant increase was observed in the number of cells after seven days of culture on the surface of the samples. This indicates that the samples are viable for use with osteoblastic cells, and thus have comparable bioactivities in vitro.
4. Conclusions
This paper proposed a precipitation method called the wet chemical technique to help synthesize HA. FTIR analysis showed all the typical absorption characteristics of HA. SEM images of the HA powders revealed large agglomerates and a distribution of small particles. These large agglomerates consisted of fine particles that were coldwelded together. SEM micrographs of HA powders showed that the crystallites of the prepared powder were nanosized and needle-like. The bulk Ca/P molar ratio was 1.71, which shows that the Ca/P ratio of the synthesized powder was slightly higher than the stoichiometric ratio (1.667), a value expected for a pure HA phase. Mechanical analysis explained that a reduction in hardness, elastic modulus, and fracture toughness occurred at a higher sintering temperature. The sample was non-cytotoxic, as the cytotoxic scale of the sample was measured as zero. Finally, the samples are favorable for use with osteoblastic cells and thus have comparable bioactivities in vitro.