Kim, Jo, and Chu: Characteristics of Hydration and Correlation on Cement-Based Thermal Insulation Material
Abstract
Cement-based thermal insulation material was manufactured using OPC, lime, anhydrite, and CSA cement in this study. The morphology and physical properties of the material were analyzed using XRD. All samples had ettringite, Ca(OH)2, and CaCO3 crystals. The XRD peak intensity of the ettringite and Ca(OH)2 slightly increased with an increase in curing time from 3 to 7 days. The compressive strength values at 28 days of specimens 1-8 were in the range of 0.25-0.32 MPa, and the compressive strength values of specimens 3-8 were > 0.3 MPa. The coefficients of correlation between compressive strength and apparent gravity at 7 days and those between compressive strength and ettringite/Ca(OH)2 XRD peak intensity at 28 days were above 0.8. That is, the compressive strength exhibited an influence on apparent gravity at 7 days and on hydrate at 28 days. The thermal conductivity of all specimens was 0.041-0.045 W/mK, and the highest value of thermal conductivity was shown by specimen 5. The coefficient of correlation between apparent gravity and thermal conductivity was 0.84. It was concluded that control of raw materials and hydrates must be considered for manufacturing of insulation materials. The cement-based thermal insulation material in this study could be used in construction fields.
Key words: Thermal insulation material, Ettringite, CSA, Compressive strength, Thermal conductivity
1. Introduction
Many studies have been conducted of late on cement-based thermal insulation materials, which can be used as thermal insulation in buildings. 1-3) In addition, Europe and China are producing and selling cement-based thermal insulation materials. However, the thermal insulation performance of cement-based thermal insulation materials is inferior to that of existing organic thermal insulation materials. This is because it is difficult to retain a large number of pores in cement-based thermal insulation materials. If the number of pores is increased to achieve thermal insulation performance similar to that of existing organic thermal insulation materials, cement-based thermal insulation materials exhibit insufficient strength, thereby making transport and cutting of such materials extremely difficult. Therefore, for cement-based thermal insulation materials to be applied to buildings, it is necessary to secure both thermal insulation characteristics and sufficient strength. The methods commonly used to create foam cement and concrete can be largely divided into pre-foaming and post-foaming methods. The pre-foaming method is used at most construction sites where direct pouring is performed. The post-foaming method is typically used in the autoclaved lightweight concrete (ALC) manufacturing process. 4) For the cement-based thermal insulation materials produced by the pre-foaming and post-foaming methods, the thermal conductivity ranges from 0.1 to 0.3 W/mK, which is much higher than that of organic thermal insulation materials (0.030-0.045 W/mK). 5-6) Therefore, it is necessary to increase the number of pores in the cement-based thermal insulation materials to reduce their thermal conductivities, but the pore increase lowers their strength. To address this problem, some researchers are making efforts to improve the strength characteristics of the solid parts (other than pores) by controlling the type and content of admixture. Farnaz Batool et al. fabricated cement foams using silica fume, and R. Siddique et al. applied metakaolin. 7) Awang et al. used fly ash to fabricate cement foams, and they also controlled the apparent gravity of the cement foams. 8) The apparent gravity of the cement foams fabricated by these researchers, however, ranged from 0.65 to 2.0 g/cm 3, and the subsequent thermal conductivity ranged from 0.15 to 0.65 W/mK. This range was significantly higher than the thermal conductivity values of the commonly used thermal insulation materials (0.030-0.045 W/mK), making these cement foams ineffective as thermal insulation materials for buildings. Therefore, in this study, conventional type 1 ordinary Portland cement (OPC), lime, and calcium sulfo-aluminate (CSA; CaO·Al2O3·SO3) cement were used to fabricate cement-based thermal insulation materials that could achieve both thermal insulation and strength characteristics. In addition, the applicability of the fabricated cement-based thermal insulation materials was examined by measuring their compressive strengths and thermal conductivities. In particular, the relationship between Ca(OH)2 (which is generated from OPC and lime) and compressive strength, as well as the relationship between ettringite (generated from CSA cement) and compressive strength, was analyzed to examine the influence of these hydrates on compressive strength.
2. Experimental Procedure
To fabricate cement-based inorganic thermal insulation materials with different CSA contents, OPC with a fineness of 3,500 cm 2/g, CSA (CaO·Al 2O 3·SO 3) cement with an approximately 33% Al 2O 3 content, lime, and anhydrite were used as starting materials. Powdered aluminum was used as a foaming agent. In addition, a foam stabilizer and a surfactant were used to delay setting. Table 1 shows the mixing proportions of these raw materials. The content of cement was decreased from 75% to 45%, while those of anhydrite and CSA were increased from 5% to 20%. In this instance, the anhydrite and CSA contents were increased by 5% in the same manner. The slurry specimens (mixed in proportions shown in Table 1) were poured into a Styrofoam mold and cured at an indoor temperature of 25 ± 2°C and a relative humidity of 60% for 24 h. The specimens were demolded after 24 h and cured in the atmosphere for 3, 7, and 28 days. At 7 and 28 days of curing, the compressive strengths of the specimens were measured after drying them at 100°C for 24 h. The compressive strength test was conducted in accordance with the lightweight foam concrete block test method (KSF 2701), and a universal testing machine (WJ-1000, Woojin Co., Ltd., South Korea) was used for the compressive strength measurement. In addition, the apparent gravity and thermal conductivity were measured after drying each specimen under at 100°C for 24 h, and the apparent gravity was calculated as weight (g)/volume (cm 3). The thermal conductivity was measured using the heat flow meter method (HC-076, EKO, Japan) specified in the thermal conductivity measurement method for heat insulating materials (KS L 9016). Moreover, XRD (D/Max-2500, Rigaku, Japan) was used to analyze the crystallinity of hydrates according to the curing days, and scanning electron microscopy (JSM-7610F, JEOL, Japan) was used for microstructure analysis.
3. Results and Discussion
3.1. Analysis of the hydration characteristics of the cement-based thermal insulation materials
After the specimens cured in the atmosphere for 3, 7, and 28 days were dried at 50°C for 24 h, their hydration characteristics were analyzed using XRD. Figs. 1, 2, and 3 show the results. Under all curing conditions, ettringite (3CaO·Al 2O 3·3CaSO 4·32H 2O), Ca(OH) 2, and CaCO 3(Calcite) peaks could be observed. As curing days increased (from 3 to 7 days), the ettringite and Ca(OH) 2 peak intensities (counts per second: CPS) remained similar or increased slightly, but CaCO 3 peak intensity decreased. In the specimens cured for 28 days, the ettringite and Ca(OH) 2 peak intensities decreased compared to those at 7 days, but the CaCO 3 peak intensity increased. Moreover, CaCO 3 with vaterite crystal structure, which was not detected at 3 and 7 days of curing, was also detected. The Ca(OH) 2 generation of ordinary cement hydrates mostly increases over a certain period, but later, the Ca(OH) 2 amount decreases as some of the Ca(OH) 2 hydrate is converted into C-S-H (xCaO·ySiO 2·zH 2O) gel or crystals. 9) In this study, the Ca(OH) 2 peak intensity also increased at 7 days compared to that at 3 days, but it decreased at 28 days. Ettringite is a hydrate produced by the reaction between CSA and gypsum, as shown in equation (1). It is known as a representative needle-shaped hydrate useful for initial strength improvement. 10)
Therefore, ettringite generation further increases as the CSA and anhydrite contents increase, as shown in Fig. 1(a) and 1(b). Fig. 1 shows the XRD patterns at 3 days of curing. Fig. 1(a) shows the No. 1 mixing condition (CSA 5% and anhydrite 5%) and Fig. 1(b) shows the No. 4 mixing condition (CSA 20% and anhydrite 20%). The ettringite main peak (2θ = 9°) intensity significantly increased in No. 4 condition compared to that in No. 1 condition. On the other hand, the Ca(OH) 2 peak intensity under No. 4 condition was lower than that under No. 1 condition. This is because the proportion of cement decreased. In Fig. 1(c) and 1(d), only the cement and lime contents were controlled after the CSA and anhydrite contents were fixed at 15%. As the cement content decreased, the ettringite peak intensity slightly decreased, but there was no significant difference in the Ca(OH) 2 peak intensity. Ettringite is generated not only by the hydration reaction of CSA and anhydrite but also by that of C 3A(3CaO·Al 2O 3) minerals and the dehydrated gypsum present in cement. 11) Therefore, if the cement content decreases, it is also likely that ettringite generation would decrease. Ca(OH) 2, however, is a representative hydrate generated in lime as well as in cement. In this study, the Ca(OH) 2 peak intensity did not show any tendency because the cement and lime contents were increased or decreased at the same time.
Figure 2 shows the XRD patterns of the specimens at 7 days of curing. As aforementioned, the ettringite and Ca(OH) 2 peak intensities remained similar or slightly increased compared to that at 3 days of curing. Moreover, as the CSA and anhydrite contents increased, the ettringite peak intensity also increased.
Figure 3 shows the XRD patterns of the specimens at 28 days of curing. The CaCO 3 peak intensity increased compared to 3 and 7 days of curing. In addition, the CaCO 3 peak of vaterite crystals was also detected. This appears to be because the inorganic thermal insulation materials, which are porous materials, easily reacted with CO 2 gas in the atmosphere, and the Ca(OH) 2 or C-S-H hydrate among cement hydrates, was converted into CaCO 3 as shown in equation (2). 12) Moreover, the XRD peak decreased as the Ca(OH)2 hydrate changed to the C-S-H hydrate after 7 days, but it appears that the generation of the C-S-H hydrate contributed to improvement of the compressive strength.
The microstructures of the cement-based thermal insulation materials were observed using specimens cured for seven days. The specimens were placed in a beaker to stop hydration. Sufficient acetone was poured in so that the specimens could be immersed, and they were maintained in a 50°C drier for 24 h. Their microstructures were then observed using a scanning electron microscope, as shown in Fig. 4(a) and 4(b). Fig. 4(a) and 4(b) show microstructures of specimens from the No. 3 and No. 4 mixing methods, respectively. In the images, pore walls and pore structures could be observed. The pore wall thickness ranged from approximately 10 to 30 μm, and the pore size was between 1 and 2 mm. The hydrates inside the pore walls were mainly composed of ettringite, and the surfaces of the pores were composed of C-S-H gel. During the microstructure observation, the ettringite hydrate generated inside the pore walls in large quantities was also detected as one of the main peaks in the XRD patterns. It was found that the microstructures and the XRD patterns were in good agreement.
3.2. Relationship between the characteristics of apparent gravity or hydration with compressive strength
A linear equation in the Origin Pro ® software from Origin-Lab (USA) was used to derive the coefficient (R) of correlation between apparent gravity, ettringite, or Ca(OH) 2 hydrate, and compressive strength for specimens 1-8. It was announced that the correlation coefficient represents a strong correlation if it is in the range of 0.3 < R ≤ 0.7 and a very strong correlation in the range of 0.7 < R ≤ 1.0. 13)
For specimens 1-8, the compressive strength was in the range 0.11-0.20 MPa at 7 days of curing and in the range 0.25-0.32 MPa at 28 days. Especially at 28 days, specimens 3-8 (but not 1 and 2), exhibited compressive strength of approximately 0.3 MPa. The compressive strength of the hydrothermally synthesized inorganic thermal insulation materials used in Europe is approximately 0.3 MPa, which is similar to the result obtained in this study. 14) This indicates that the specimens (except 1 and 2), exhibit sufficient workability.
Figure 5 shows the relationship between apparent gravity and compressive strength for specimens 1-8. The compressive strength showed a tendency to increase as the apparent gravity increased. The correlation coefficient (R) was +0.83 at 7 days and +0.61 at 28 days. The coefficient of correlation between compressive strength and apparent gravity slightly decreased as curing days increased. This indicates that compressive strength can be affected by factors other than apparent gravity as curing days increase. Therefore, the XRD peak intensities of hydrates at different curing days were compared in this study. The relationship between ettringite (first peak 9°) peak intensity or Ca(OH) 2 (first peak 18°) and compressive strength was analyzed, and the results are shown in Fig. 6 and 7.
Figure 6(a) and 6(b) show the relationships between compressive strength and ettringite peak intensity at 7 and 28 days, respectively. The coefficient of correlation between compressive strength and ettringite peak intensity was +0.64 at 7 days and +0.84 at 28 days. The coefficient of correlation between compressive strength and ettringite peak intensity increased as curing days increased (from 7 to 28 days). Fig. 7(a) and 7(b) show the relationships between compressive strength and Ca(OH) 2 peak intensity at 7 and 28 days, respectively. The coefficient of correlation between compressive strength and Ca(OH) 2 peak intensity was −0.79 at 7 days and−0.90 at 28 days. The correlation between compressive strength and Ca(OH) 2 peak intensity increased as curing days increased, but a negative correlation was observed, unlike for ettringite. The results above show that compressive strength tended to increase as ettringite generation increased but tended to decrease as the Ca(OH) 2 generation increased at 7 and 28 curing days.
The correlation coefficient between apparent gravity and compressive strength at 7 days and that between ettringite or Ca(OH)2 peak intensity and compressive strength at 28 days were higher than 0.8. This indicates that compressive strength is more dependent on apparent gravity at 7 days and on ettringite and Ca(OH)2 at 28 days. In other words, the main factors that can affect the compressive strength of cement-based thermal insulation materials may vary depending on curing days.
3.3. Relationship between apparent gravity or hydrate peak intensities and thermal conductivity
After specimens 1-8 were cured for seven days, thermal conductivity, apparent gravity, and XRD were measured to derive the relationship between ettringite peak intensity, Ca(OH)2 peak intensity, or apparent gravity and thermal conductivity. The thermal conductivities of all specimens ranged from 0.041 to 0.045 W/mK, and specimen 5 exhibited the highest thermal conductivity (0.045 W/mK). This is because the pore generation decreased for specimen 5 because its relatively low lime content led to low Ca(OH)2 generation, even though the Al foaming agent generally reacts with Ca(OH)2 and generates hydrogen gas (2Al + 3Ca(OH)2 + 6H2O → 3CaO + Al2O3 + 6H2O + 3H2↑).
Figure 8(a) shows the relationship between apparent gravity and thermal conductivity, and Fig. 8(b) shows the relationship between ettringite peak intensity and thermal conductivity. Fig. 8(c) shows the relationship between Ca(OH) 2 peak intensity and thermal conductivity. As shown in Fig. 8(a), the coefficient of correlation between apparent gravity and thermal conductivity was +0.84. A general correlation was derived by which the thermal conductivity increases alongside the increase in apparent gravity. The correlation coefficient between ettringite peak intensity and thermal conductivity was −0.40, and that between Ca(OH) 2 peak intensity and thermal conductivity was −0.35. The thermal conductivity showed low correlation with ettringite and Ca(OH) 2 peak intensities, confirming that the thermal conductivity is affected more by apparent gravity than by hydrates.
4. Conclusions
In this study, conventional ordinary Portland cement (OPC), lime, and calcium sulfo-aluminate (CSA) cement were used to fabricate cement-based thermal insulation materials. After cement-based thermal insulation materials were fabricated, their applicability as substitutes for organic thermal insulation materials was examined by measuring the compressive strength and thermal conductivity. In addition, the relationship between Ca(OH)2 (which is generated from OPC and lime) and compressive strength, as well as the relationship between ettringite (generated from CSA cement) and compressive strength was analyzed to examine the effects of these hydrates on compressive strength.
In all specimens that used OPC, CSA, and anhydrite, ettringite, Ca(OH)2, and CaCO3 crystals were present. As curing days increased from three to seven days, ettringite and Ca(OH)2 peak intensities remained similar or increased slightly. For specimens 1-8, the compressive strength was in the range 0.11-0.20 MPa at 7 days of curing and in the range 0.25-0.32 MPa at 28 days. At 28 days, specimens 3-8 (not 1 and 2), exhibited compressive strength of approximately 0.3 MPa. This indicates that all the specimens, except No. 1 and 2, can secure sufficient workability. The correlation coefficient between apparent gravity and compressive strength at 7 days and that between ettringite/Ca(OH)2 peak intensity and compressive strength at 28 days were higher than 0.8. In other words, the compressive strength was more dependent on apparent gravity at 7 days and on hydrates at 28 days. Therefore, it was estimated that the main factors that can affect the compressive strength of cement-based thermal insulation materials may vary depending on curing days. The thermal conductivities of all specimens ranged from 0.041 to 0.045 W/mK, and specimen 5 exhibited the highest thermal conductivity (0.045 W/mK). Moreover, the coefficient of correlation between apparent gravity and thermal conductivity was +0.84. A general correlation was derived showing that the thermal conductivity increases alongside the increase in apparent gravity. Based on the above compressive strength and thermal conductivity characteristics, it was estimated that cement-based thermal insulation materials could be applied to construction sites. It was found that it is important to control starting materials and to generate appropriate hydrates for the production of cement-based thermal insulation materials in the future.
Fig. 1
XRD patterns of thermal insulation materials at 3 days. 
Fig. 2
XRD patterns of thermal insulation materials at 7 days. 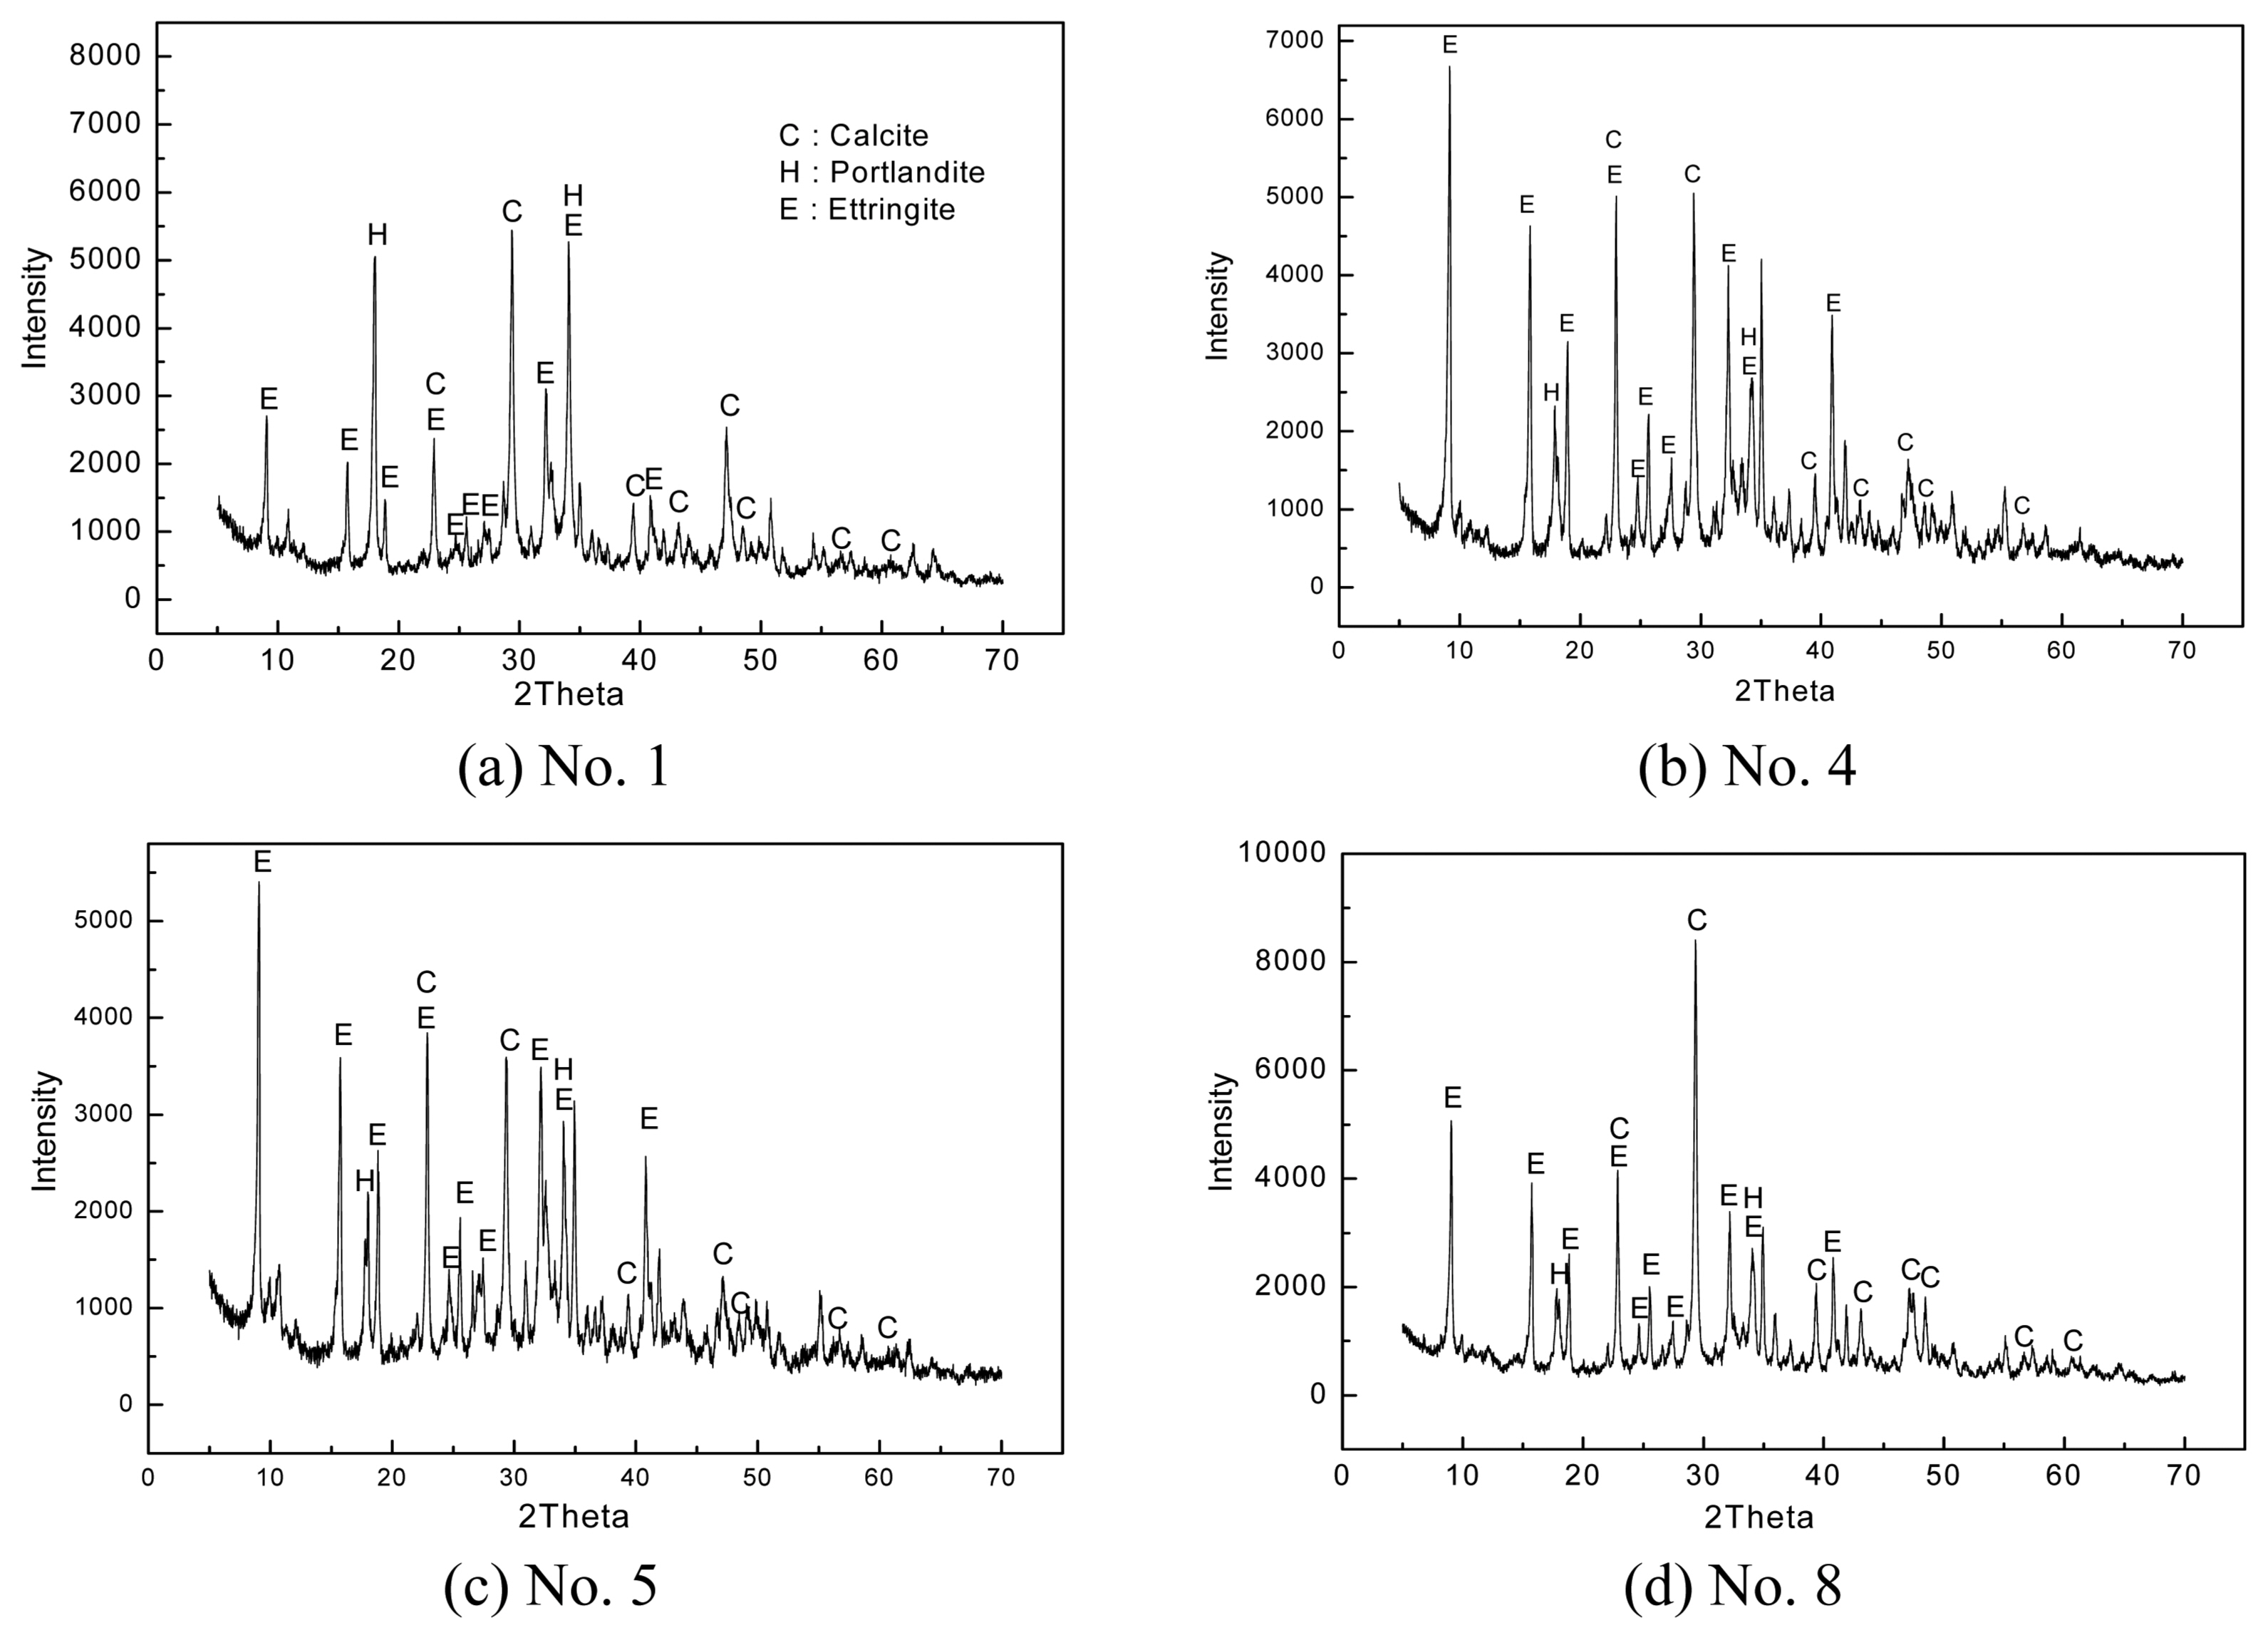
Fig. 3
XRD patterns of thermal insulation materials at 28 days. 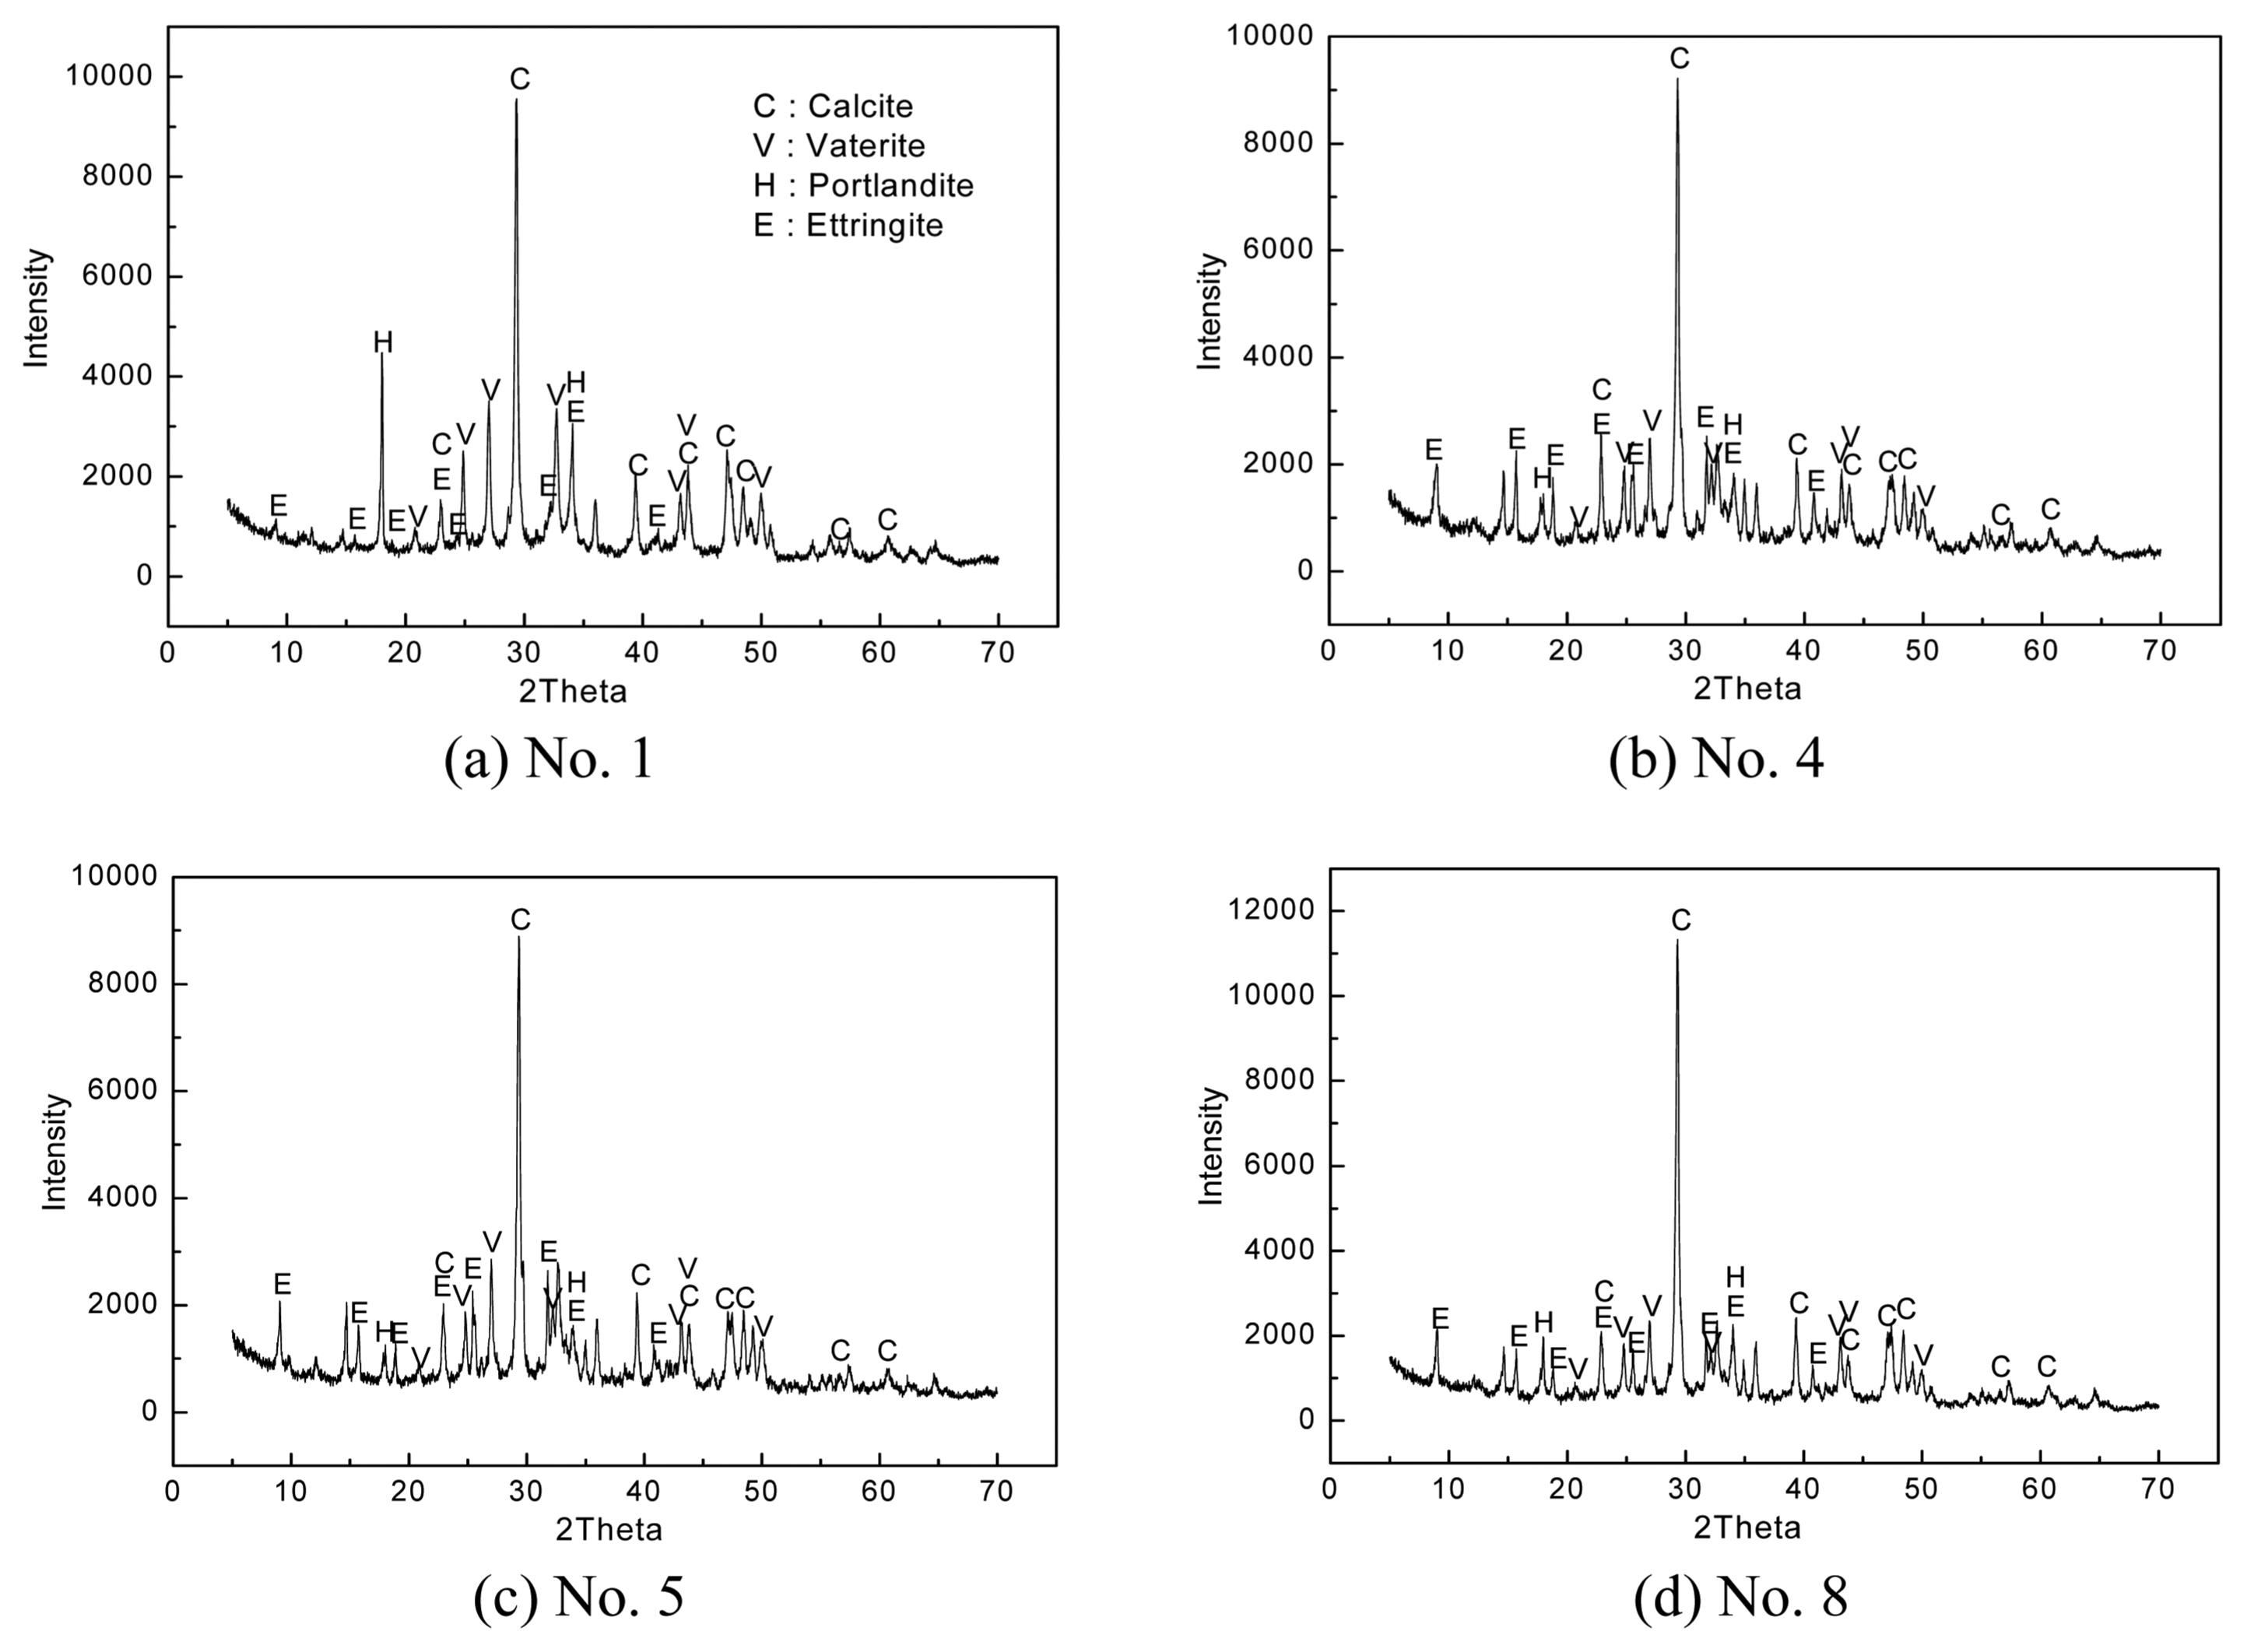
Fig. 4
Microstructure of thermal insulation materials at 7 days. 
Fig. 5
Relationship of apparent gravity and compressive strength. 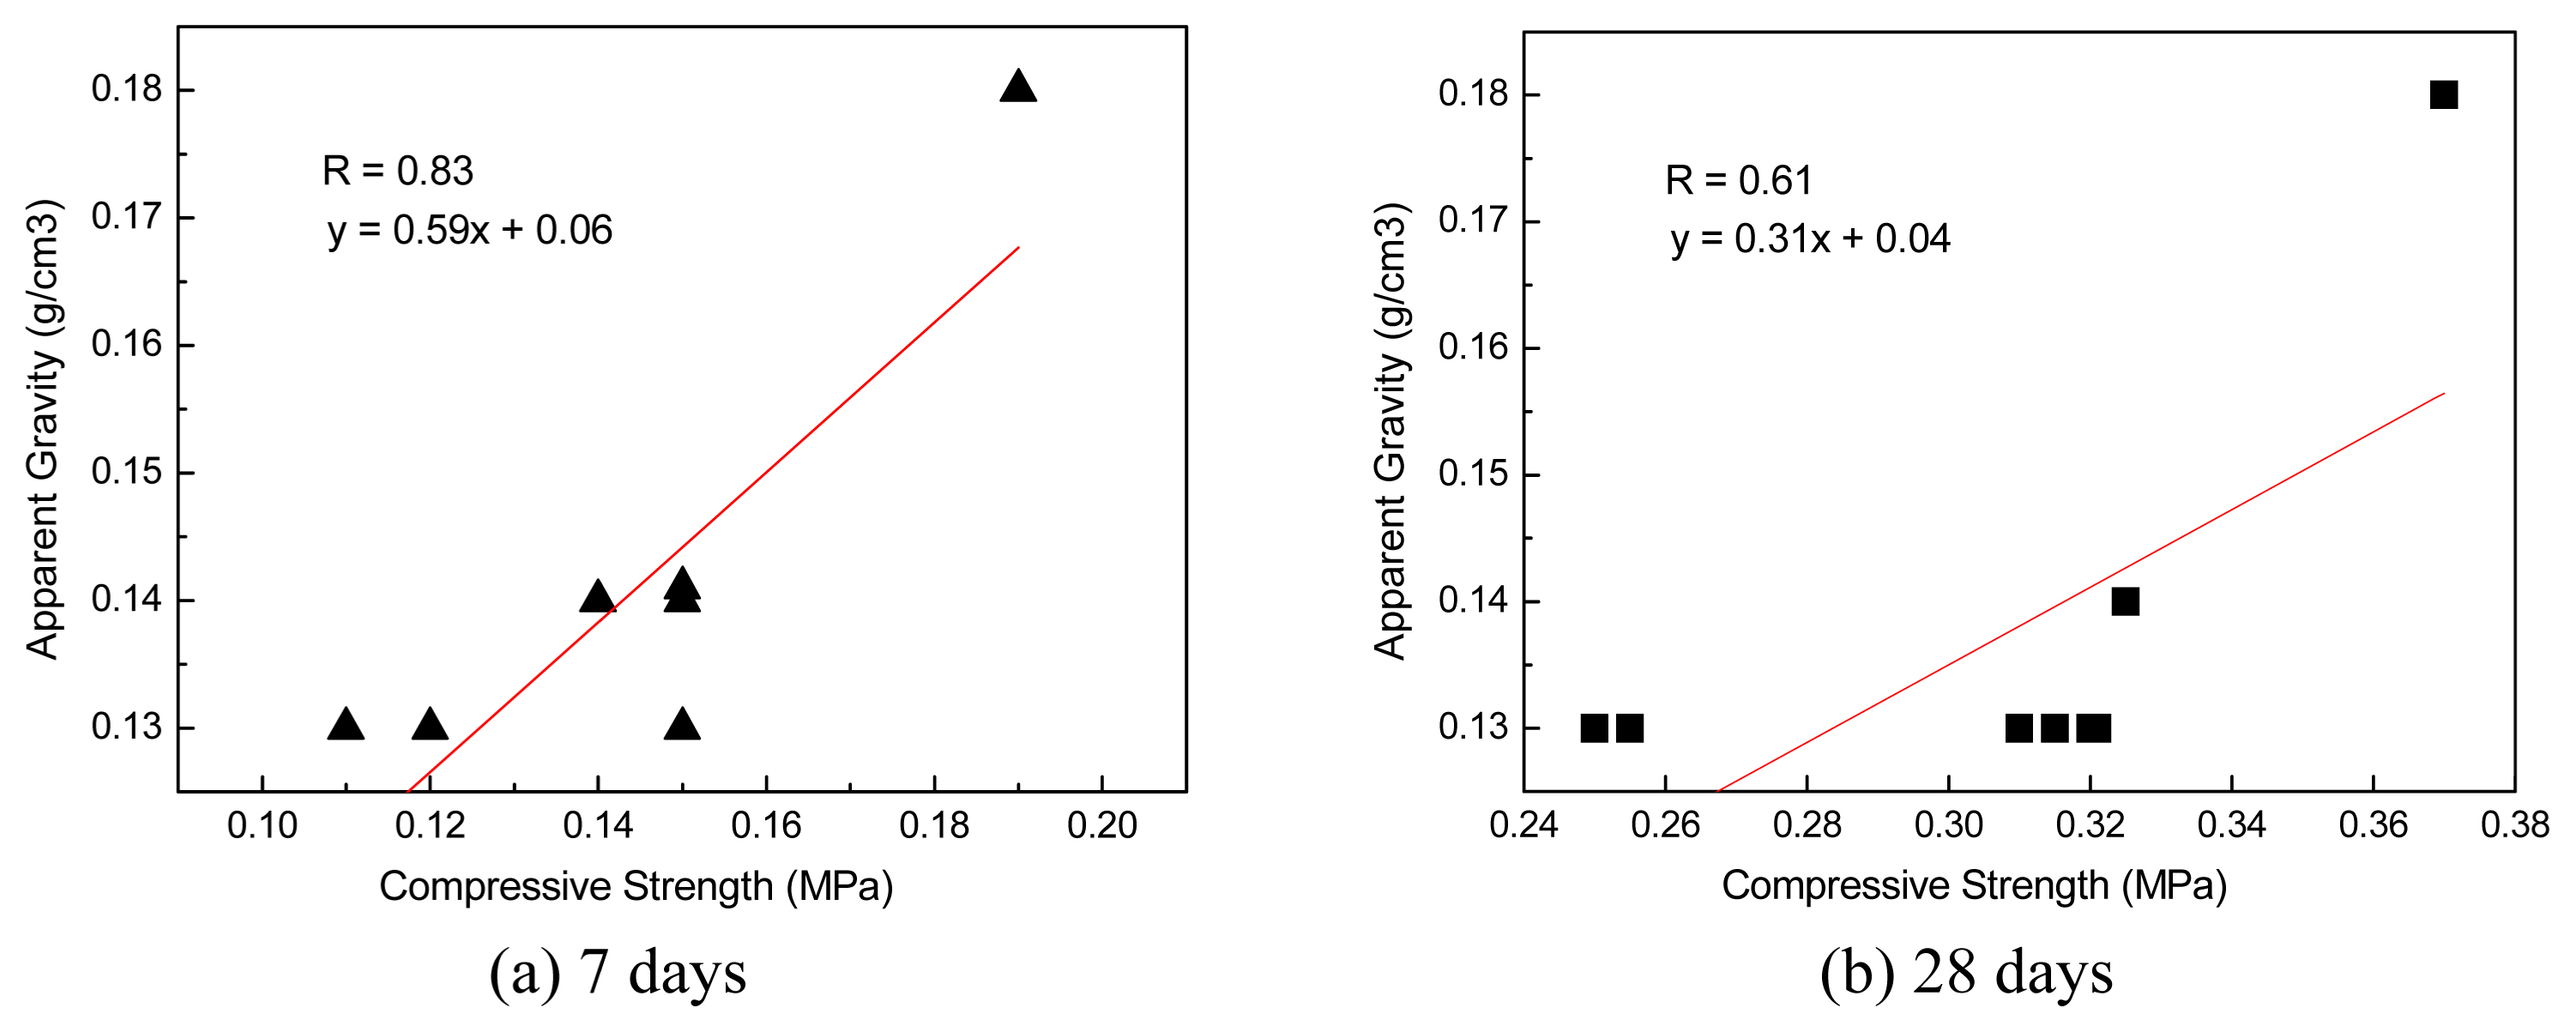
Fig. 6
Relationship of ettringite peak intensity and compressive strength. 
Fig. 7
Relationship of Ca(OH)2 peak intensity and compressive strength. 
Fig. 8
Relationship of Apparent gravity, hydrate peak intensities, and thermal conductivity. 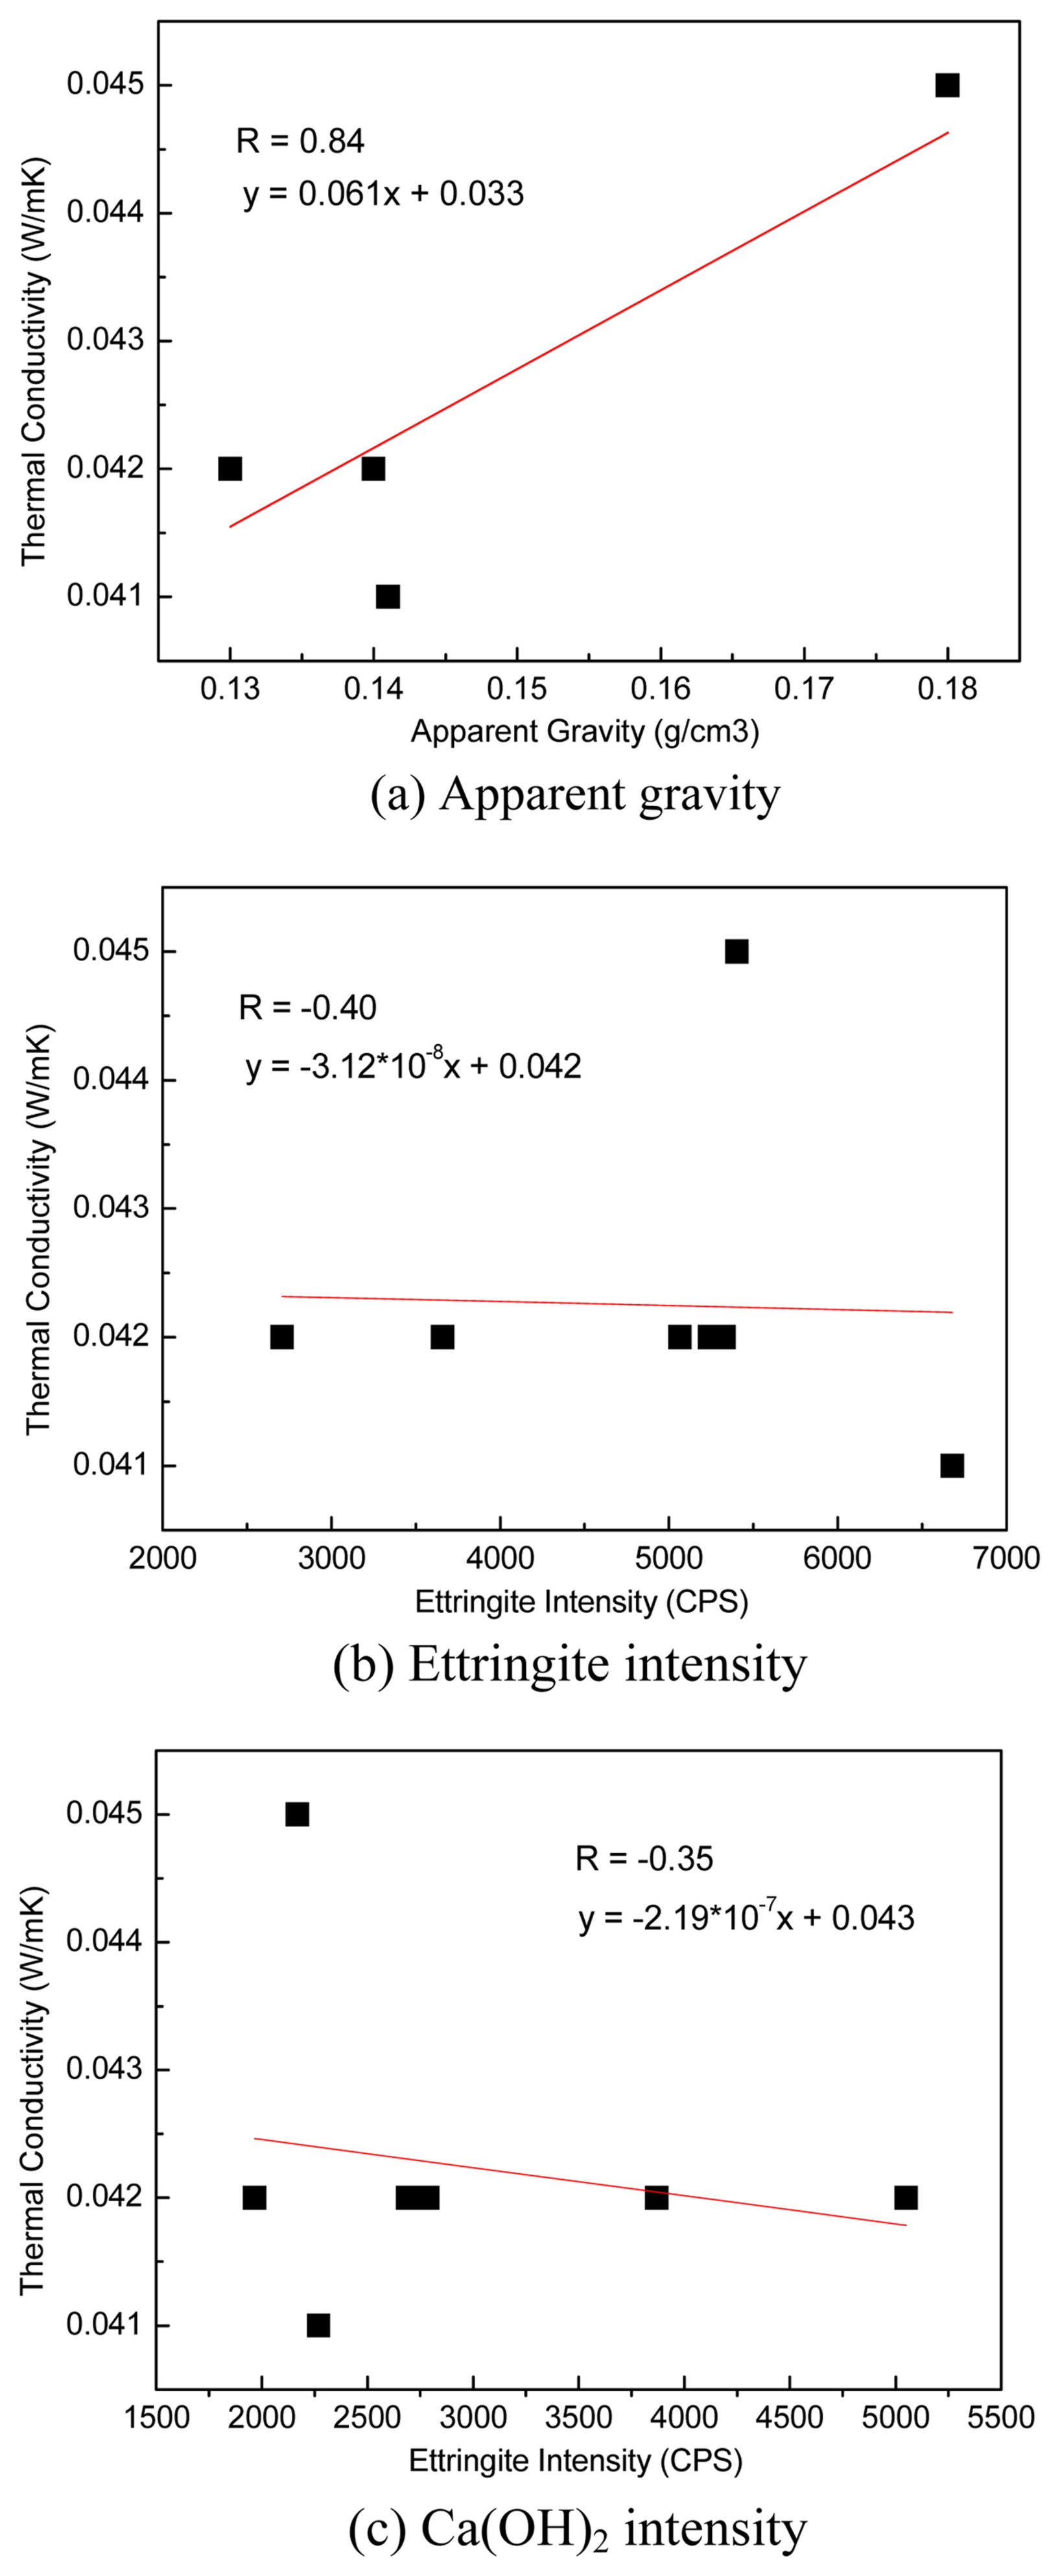
Table 1
Mixing Ratio of Cement-Based Thermal Insulation Materials (Unit: %)
|
(a) Mixing ratio of CSA and OPC for cement-based thermal insulation materials |
|
|
No. |
OPC |
Lime |
Anhydrite |
CSA |
Stabilizer |
Al Powder |
Surfactant |
Water |
|
1 |
75 |
15 |
5 |
5 |
0.05 |
0.6 |
0.3 |
130 |
|
2 |
65 |
15 |
10 |
10 |
0.05 |
0.6 |
0.3 |
130 |
|
3 |
55 |
15 |
15 |
15 |
0.05 |
0.6 |
0.3 |
130 |
|
4 |
45 |
15 |
20 |
20 |
0.05 |
0.6 |
0.3 |
130 |
|
(b) Mixing ratio of lime and OPC at CSA 15 wt% |
|
|
No. |
OPC |
Lime |
Anhydrite |
CSA |
Stabilizer |
Al Powder |
Surfactant |
Water |
|
5 |
65 |
5 |
15 |
15 |
0.05 |
0.6 |
0.3 |
130 |
|
6 |
60 |
10 |
15 |
15 |
0.05 |
0.6 |
0.3 |
130 |
|
7 |
55 |
15 |
15 |
15 |
0.05 |
0.6 |
0.3 |
130 |
|
8 |
50 |
20 |
15 |
15 |
0.05 |
0.6 |
0.3 |
130 |
REFERENCES
1. A. Dixit, SD. Pang, and SH. Kang, “Lightweight Structural Cement Composites with Expanded Polystyrene for Enhanced Thermal Insulation,” Cem Concr Compos, 102 185-97 (2019).  2. X. Song, R. Zheng, and R. Li, “Study on Thermal Conductivity of Cement with Thermal Conductive Materials in Geothermal Well,” Geothermics, 81 1-11 (2019). 3. J. Stolz, Y. Boluk, and V. Bindiganavile, “Wood Ash as a Supplementary Cementing Material in Foams for Thermal and Acoustic Insulation,” Constr Build Mater, 215 104-13 (2019). 4. G. Pachideh, and M. Gholhaki, “Effect of Pozzolanic Materials on Mechanical Properties and Water Absorption of Autoclaved Aerated Concrete,” J Build Eng, 26 100856(2019). 5. I. Asadi, P. Shafigh, and NB. Mahyuddin, “Thermal Conductivity of Concrete - A Review,” J Build Eng, 20 81-93 (2018). 6. C. Tasdemir, and O. Sengul, “A Comparative Study on the Thermal Conductivities and Mechanical Properties of Lightweight Concretes,” Energy Build, 151 469-75 (2017). 7. F. Batool, and V. Bindiganavile, “Microstructure and Thermal Conductivity of Cement-Based Foam,” J Build Eng, 20 696-704 (2018).
8. H. Awang, and AF. Roslan, “Effect of Additives on Mechanical and Thermal Properties of Lightweight Foamed Concrete,” Adv Appl Sci Res, 5 [5] 3326-38 (2012).
9. PC. Hewlett, and M. Liska, “Hydration, Setting and Hardening of Portland Cement,”; pp. 246-54 in Lea’s Chemistry of Cement and Concrete, Chapter 5 Fourth Edition. Butterworth- Heinemann, 2017. 10. D. Gastaldi, G. Paul, L. Marchese, and F. Canonico, “Hydration Products in Sulfoaluminate Cements: Evaluation of Amorphous Phases by XRD Solid State NMR,” Cem Concr Compos, 90 162-73 (2016).
11. PC. Hewlett, and M. Liska, “Hydration, Setting and Hardening of Portland Cement,”; pp. 260-62 in Lea’s Chemistry of Cement and Concrete, Chapter 5 Fourth Edition. Butterworth- Heinemann, 2017. 12. T. Chen, X. Gao, and L. Qin, “Mathmatical Modeling of Accelerated Carbonation Curing of Portland Cement Paste at Early Age,” Cem Concr Compos, 120 187-97 (2019). 13. H. Akoglu, “User’s Guide to Correlation Coefficient,” Turk J Emerg Med, 18 [3] 91-3 (2018).
|
|